Immigrants from Western Asia Disability Age Under 5

COMPARE

Immigrants from Western Asia
Race
Ancestry
AfghanAfricanAlaska NativeAlaskan AthabascanAlbanianAleutAlsatianAmericanApacheArabArapahoArgentineanArmenianAssyrian/Chaldean/SyriacAustralianAustrianBahamianBangladeshiBarbadianBasqueBelgianBelizeanBermudanBhutaneseBlackfeetBolivianBrazilianBritishBritish West IndianBulgarianBurmeseCajunCambodianCanadianCape VerdeanCarpatho RusynCelticCentral AmericanCentral American IndianCherokeeCheyenneChickasawChileanChineseChippewaChoctawColombianColvilleComancheCosta RicanCreeCreekCroatianCrowCubanCypriotCzechCzechoslovakianDanishDelawareDominicanDutchDutch West IndianEastern EuropeanEcuadorianEgyptianEnglishEstonianEthiopianEuropeanFijianFilipinoFinnishFrenchFrench American IndianFrench CanadianGermanGerman RussianGhanaianGreekGuamanian/ChamorroGuatemalanGuyaneseHaitianHmongHonduranHopiHoumaHungarianIcelanderIndian (Asian)IndonesianInupiatIranianIraqiIrishIroquoisIsraeliItalianJamaicanJapaneseJordanianKenyanKiowaKoreanLaotianLatvianLebaneseLiberianLithuanianLumbeeLuxembourgerMacedonianMalaysianMalteseMarshalleseMenomineeMexicanMexican American IndianMongolianMoroccanNative HawaiianNavajoNepaleseNew ZealanderNicaraguanNigerianNorthern EuropeanNorwegianOkinawanOsageOttawaPaiutePakistaniPalestinianPanamanianParaguayanPennsylvania GermanPeruvianPimaPolishPortuguesePotawatomiPuebloPuerto RicanPuget Sound SalishRomanianRussianSalvadoranSamoanScandinavianScotch-IrishScottishSeminoleSenegaleseSerbianShoshoneSierra LeoneanSiouxSlavicSlovakSloveneSomaliSouth AfricanSouth AmericanSouth American IndianSoviet UnionSpaniardSpanishSpanish AmericanSpanish American IndianSri LankanSubsaharan AfricanSudaneseSwedishSwissSyrianTaiwaneseThaiTlingit-HaidaTohono O'OdhamTonganTrinidadian and TobagonianTsimshianTurkishU.S. Virgin IslanderUgandanUkrainianUruguayanUteVenezuelanVietnameseWelshWest IndianYakamaYaquiYugoslavianYumanYup'ikZimbabwean
Immigration
NonimmigrantsImmigrantsAfghanistanAfricaAlbaniaArgentinaArmeniaAsiaAustraliaAustriaBahamasBangladeshBarbadosBelarusBelgiumBelizeBoliviaBosnia and HerzegovinaBrazilBulgariaBurma/MyanmarCabo VerdeCambodiaCameroonCanadaCaribbeanCentral AmericaChileChinaColombiaCongoCosta RicaCroatiaCubaCzechoslovakiaDenmarkDominicaDominican RepublicEastern AfricaEastern AsiaEastern EuropeEcuadorEgyptEl SalvadorEnglandEritreaEthiopiaEuropeFijiFranceGermanyGhanaGreeceGrenadaGuatemalaGuyanaHaitiHondurasHong KongHungaryIndiaIndonesiaIranIraqIrelandIsraelItalyJamaicaJapanJordanKazakhstanKenyaKoreaKuwaitLaosLatin AmericaLatviaLebanonLiberiaLithuaniaMalaysiaMexicoMicronesiaMiddle AfricaMoldovaMoroccoNepalNetherlandsNicaraguaNigeriaNorth AmericaNorth MacedoniaNorthern AfricaNorthern EuropeNorwayOceaniaPakistanPanamaPeruPhilippinesPolandPortugalRomaniaRussiaSaudi ArabiaScotlandSenegalSerbiaSierra LeoneSingaporeSomaliaSouth AfricaSouth AmericaSouth Central AsiaSouth Eastern AsiaSouthern EuropeSpainSri LankaSt. Vincent and the GrenadinesSudanSwedenSwitzerlandSyriaTaiwanThailandTrinidad and TobagoTurkeyUgandaUkraineUruguayUzbekistanVenezuelaVietnamWest IndiesWestern AfricaWestern AsiaWestern EuropeYemenZaireZimbabweAzores
Select to Compare
Race
Ancestry
AfghanAfricanAlaska NativeAlaskan AthabascanAlbanianAleutAlsatianAmericanApacheArabArapahoArgentineanArmenianAssyrian/Chaldean/SyriacAustralianAustrianBahamianBangladeshiBarbadianBasqueBelgianBelizeanBermudanBhutaneseBlackfeetBolivianBrazilianBritishBritish West IndianBulgarianBurmeseCajunCambodianCanadianCape VerdeanCarpatho RusynCelticCentral AmericanCentral American IndianCherokeeCheyenneChickasawChileanChineseChippewaChoctawColombianColvilleComancheCosta RicanCreeCreekCroatianCrowCubanCypriotCzechCzechoslovakianDanishDelawareDominicanDutchDutch West IndianEastern EuropeanEcuadorianEgyptianEnglishEstonianEthiopianEuropeanFijianFilipinoFinnishFrenchFrench American IndianFrench CanadianGermanGerman RussianGhanaianGreekGuamanian/ChamorroGuatemalanGuyaneseHaitianHmongHonduranHopiHoumaHungarianIcelanderIndian (Asian)IndonesianInupiatIranianIraqiIrishIroquoisIsraeliItalianJamaicanJapaneseJordanianKenyanKiowaKoreanLaotianLatvianLebaneseLiberianLithuanianLumbeeLuxembourgerMacedonianMalaysianMalteseMarshalleseMenomineeMexicanMexican American IndianMongolianMoroccanNative HawaiianNavajoNepaleseNew ZealanderNicaraguanNigerianNorthern EuropeanNorwegianOkinawanOsageOttawaPaiutePakistaniPalestinianPanamanianParaguayanPennsylvania GermanPeruvianPimaPolishPortuguesePotawatomiPuebloPuerto RicanPuget Sound SalishRomanianRussianSalvadoranSamoanScandinavianScotch-IrishScottishSeminoleSenegaleseSerbianShoshoneSierra LeoneanSiouxSlavicSlovakSloveneSomaliSouth AfricanSouth AmericanSouth American IndianSoviet UnionSpaniardSpanishSpanish AmericanSpanish American IndianSri LankanSubsaharan AfricanSudaneseSwedishSwissSyrianTaiwaneseThaiTlingit-HaidaTohono O'OdhamTonganTrinidadian and TobagonianTsimshianTurkishU.S. Virgin IslanderUgandanUkrainianUruguayanUteVenezuelanVietnameseWelshWest IndianYakamaYaquiYugoslavianYumanYup'ikZimbabwean
Immigration
NonimmigrantsImmigrantsAfghanistanAfricaAlbaniaArgentinaArmeniaAsiaAustraliaAustriaBahamasBangladeshBarbadosBelarusBelgiumBelizeBoliviaBosnia and HerzegovinaBrazilBulgariaBurma/MyanmarCabo VerdeCambodiaCameroonCanadaCaribbeanCentral AmericaChileChinaColombiaCongoCosta RicaCroatiaCubaCzechoslovakiaDenmarkDominicaDominican RepublicEastern AfricaEastern AsiaEastern EuropeEcuadorEgyptEl SalvadorEnglandEritreaEthiopiaEuropeFijiFranceGermanyGhanaGreeceGrenadaGuatemalaGuyanaHaitiHondurasHong KongHungaryIndiaIndonesiaIranIraqIrelandIsraelItalyJamaicaJapanJordanKazakhstanKenyaKoreaKuwaitLaosLatin AmericaLatviaLebanonLiberiaLithuaniaMalaysiaMexicoMicronesiaMiddle AfricaMoldovaMoroccoNepalNetherlandsNicaraguaNigeriaNorth AmericaNorth MacedoniaNorthern AfricaNorthern EuropeNorwayOceaniaPakistanPanamaPeruPhilippinesPolandPortugalRomaniaRussiaSaudi ArabiaScotlandSenegalSerbiaSierra LeoneSingaporeSomaliaSouth AfricaSouth AmericaSouth Central AsiaSouth Eastern AsiaSouthern EuropeSpainSri LankaSt. Vincent and the GrenadinesSudanSwedenSwitzerlandSyriaTaiwanThailandTrinidad and TobagoTurkeyUgandaUkraineUruguayUzbekistanVenezuelaVietnamWest IndiesWestern AfricaWestern EuropeYemenZaireZimbabweAzores
Disability Age Under 5
Income
Poverty
Unemployment
Labor Participation
Family Structure
Vehicle Availability
Education Level
Disability

Immigrants from Western Asia Disability Age Under 5
Exceptional

1.1%
DISABILITY | AGE UNDER 5
99.2/ 100
METRIC RATING
60th/ 347
METRIC RANK

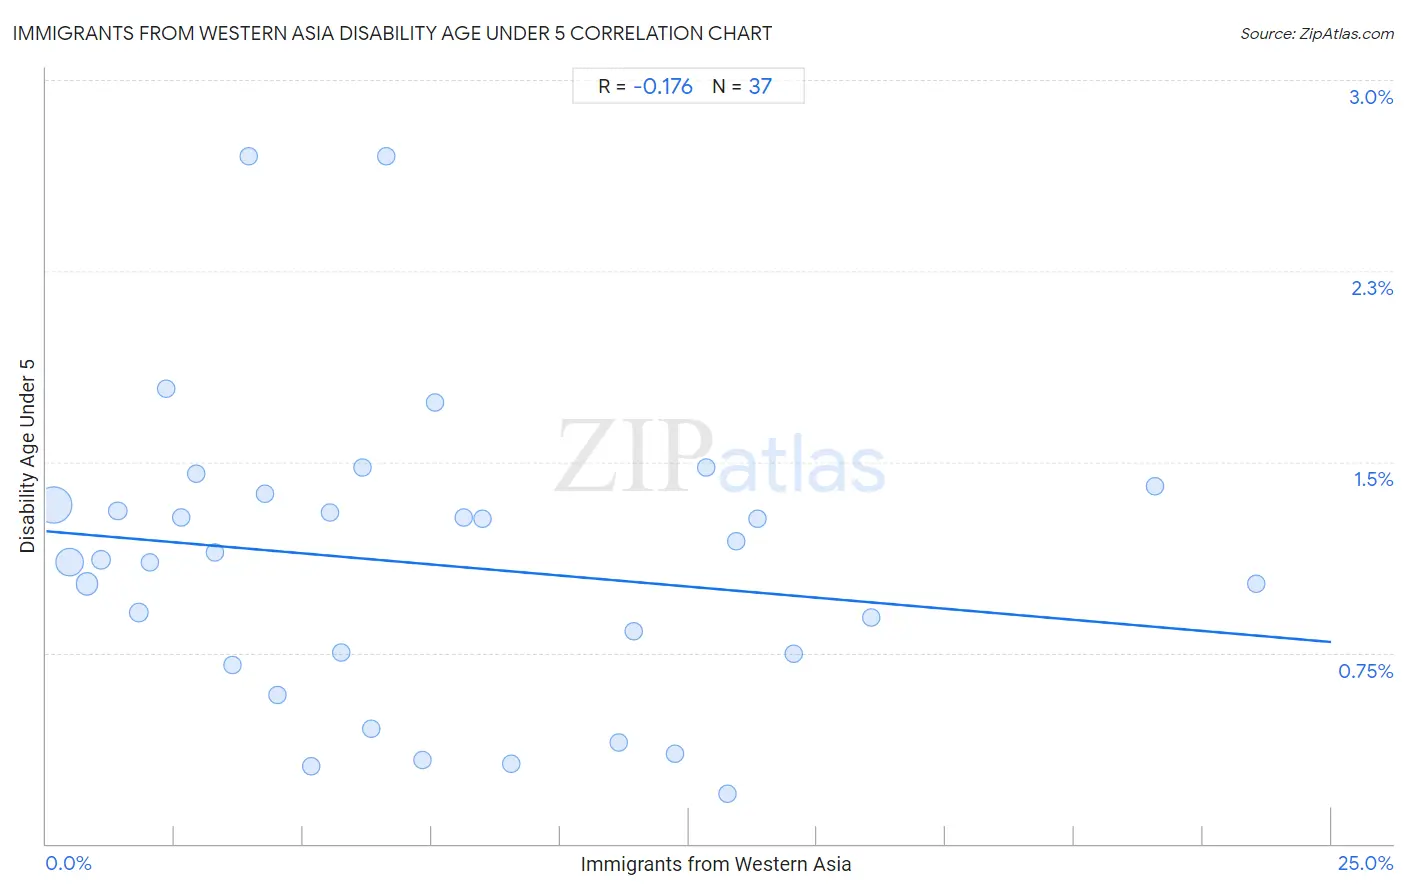
Immigrants from Western Asia Disability Age Under 5 Correlation Chart

The statistical analysis conducted on geographies consisting of 218,056,003 people shows a poor negative correlation between the proportion of Immigrants from Western Asia and percentage of population with a disability under the age of 5 in the United States with a correlation coefficient (R) of -0.176 and weighted average of 1.1%. On average, for every 1% (one percent) increase in Immigrants from Western Asia within a typical geography, there is a decrease of 0.017% in percentage of population with a disability under the age of 5.
Immigrants from Western Asia Disability Age Under 5
It is essential to understand that the correlation between the percentage of Immigrants from Western Asia and percentage of population with a disability under the age of 5 does not imply a direct cause-and-effect relationship. It remains uncertain whether the presence of Immigrants from Western Asia influences an upward or downward trend in the level of percentage of population with a disability under the age of 5 within an area, or if Immigrants from Western Asia simply ended up residing in those areas with higher or lower levels of percentage of population with a disability under the age of 5 due to other factors.

Demographics Similar to Immigrants from Western Asia by Disability Age Under 5

In terms of disability age under 5, the demographic groups most similar to Immigrants from Western Asia are Immigrants from Ethiopia (1.1%, a difference of 0.060%), Immigrants from Switzerland (1.1%, a difference of 0.070%), Immigrants from Vietnam (1.1%, a difference of 0.18%), Egyptian (1.1%, a difference of 0.64%), and Immigrants from Malaysia (1.1%, a difference of 0.76%).
DemographicsRating | RankDisability Age Under 5
Asians
99.6
/100
|
#53
Exceptional
1.1%
Immigrants from El Salvador
99.6
/100
|
#54
Exceptional
1.1%
Salvadorans
99.5
/100
|
#55
Exceptional
1.1%
Ecuadorians
99.5
/100
|
#56
Exceptional
1.1%
Assyrians/Chaldeans/Syriacs
99.5
/100
|
#57
Exceptional
1.1%
Immigrants from Egypt
99.4
/100
|
#58
Exceptional
1.1%
Immigrants from Malaysia
99.4
/100
|
#59
Exceptional
1.1%
Immigrants from Western Asia
99.2
/100
|
#60
Exceptional
1.1%
Immigrants from Ethiopia
99.2
/100
|
#61
Exceptional
1.1%
Immigrants from Switzerland
99.2
/100
|
#62
Exceptional
1.1%
Immigrants from Vietnam
99.1
/100
|
#63
Exceptional
1.1%
Egyptians
98.9
/100
|
#64
Exceptional
1.1%
Immigrants from Korea
98.8
/100
|
#65
Exceptional
1.1%
Immigrants from Indonesia
98.7
/100
|
#66
Exceptional
1.1%
Immigrants from Belize
98.7
/100
|
#67
Exceptional
1.1%

Immigrants from Western Asia Disability Age Under 5 Correlation Summary

MeasurementImmigrants from Western Asia DataDisability Age Under 5 Data
Minimum0.14%0.20%
Maximum23.5%2.7%
Range23.4%2.5%
Mean7.4%1.1%
Median6.1%1.1%
Interquartile 25% (IQ1)2.8%0.72%
Interquartile 75% (IQ3)11.8%1.4%
Interquartile Range (IQR)9.0%0.63%
Standard Deviation (Sample)5.8%0.57%
Standard Deviation (Population)5.7%0.57%

Correlation Details

Immigrants from Western Asia PercentileSample SizeDisability Age Under 5
[
0.0%
-
0.5%
]
0.14%
105,566,7871.3%
[
0.0%
-
0.5%
]
0.45%
60,608,4801.1%
[
0.5%
-
1.0%
]
0.79%
26,924,7641.0%
[
1.0%
-
1.5%
]
1.07%
9,317,5771.1%
[
1.0%
-
1.5%
]
1.39%
3,937,9081.3%
[
1.5%
-
2.0%
]
1.79%
6,469,0320.91%
[
2.0%
-
2.5%
]
2.02%
1,414,7461.1%
[
2.0%
-
2.5%
]
2.34%
599,2031.8%
[
2.5%
-
3.0%
]
2.64%
479,5261.3%
[
2.5%
-
3.0%
]
2.92%
498,6261.5%
[
3.0%
-
3.5%
]
3.29%
481,1731.1%
[
3.5%
-
4.0%
]
3.62%
117,0150.70%
[
3.5%
-
4.0%
]
3.95%
48,4152.7%
[
4.0%
-
4.5%
]
4.26%
181,8221.4%
[
4.0%
-
4.5%
]
4.50%
81,9510.59%
[
5.0%
-
5.5%
]
5.15%
123,7670.30%
[
5.5%
-
6.0%
]
5.52%
31,5171.3%
[
5.5%
-
6.0%
]
5.75%
162,1110.75%
[
6.0%
-
6.5%
]
6.15%
102,9941.5%
[
6.0%
-
6.5%
]
6.32%
33,1700.45%
[
6.5%
-
7.0%
]
6.62%
29,3302.7%
[
7.0%
-
7.5%
]
7.32%
73,6120.33%
[
7.5%
-
8.0%
]
7.56%
19,6251.7%
[
8.0%
-
8.5%
]
8.12%
69,6381.3%
[
8.0%
-
8.5%
]
8.49%
9,9601.3%
[
9.0%
-
9.5%
]
9.05%
43,5520.31%
[
11.0%
-
11.5%
]
11.14%
45,9370.40%
[
11.0%
-
11.5%
]
11.43%
27,1190.83%
[
12.0%
-
12.5%
]
12.23%
33,1740.35%
[
12.5%
-
13.0%
]
12.83%
34,9211.5%
[
13.0%
-
13.5%
]
13.25%
43,2130.20%
[
13.0%
-
13.5%
]
13.42%
59,7751.2%
[
13.5%
-
14.0%
]
13.84%
105,7211.3%
[
14.5%
-
15.0%
]
14.54%
133,7440.75%
[
16.0%
-
16.5%
]
16.05%
62,4740.89%
[
21.5%
-
22.0%
]
21.57%
40,3921.4%
[
23.5%
-
24.0%
]
23.55%
43,2321.0%