Immigrants from Morocco Disability Age Under 5
COMPARE
Immigrants from Morocco
Select to Compare
Disability Age Under 5
Immigrants from Morocco Disability Age Under 5
1.2%
DISABILITY | AGE UNDER 5
96.0/ 100
METRIC RATING
102nd/ 347
METRIC RANK
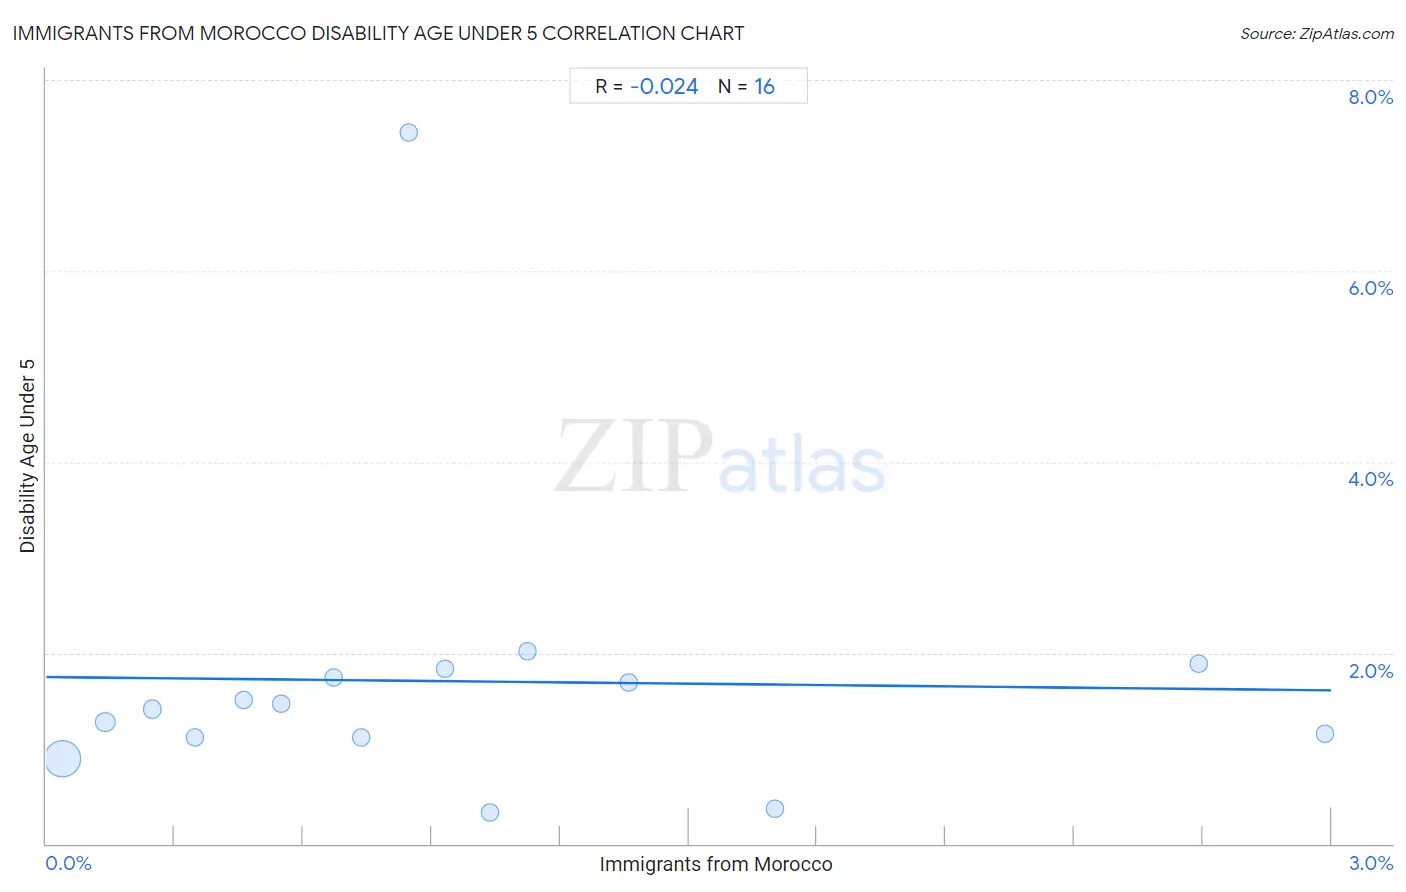
Immigrants from Morocco Disability Age Under 5 Correlation Chart
The statistical analysis conducted on geographies consisting of 120,271,602 people shows no correlation between the proportion of Immigrants from Morocco and percentage of population with a disability under the age of 5 in the United States with a correlation coefficient (R) of -0.024 and weighted average of 1.2%. On average, for every 1% (one percent) increase in Immigrants from Morocco within a typical geography, there is a decrease of 0.046% in percentage of population with a disability under the age of 5.
It is essential to understand that the correlation between the percentage of Immigrants from Morocco and percentage of population with a disability under the age of 5 does not imply a direct cause-and-effect relationship. It remains uncertain whether the presence of Immigrants from Morocco influences an upward or downward trend in the level of percentage of population with a disability under the age of 5 within an area, or if Immigrants from Morocco simply ended up residing in those areas with higher or lower levels of percentage of population with a disability under the age of 5 due to other factors.
Demographics Similar to Immigrants from Morocco by Disability Age Under 5
In terms of disability age under 5, the demographic groups most similar to Immigrants from Morocco are Immigrants from Nicaragua (1.2%, a difference of 0.0%), Immigrants from Uganda (1.1%, a difference of 0.060%), Indonesian (1.2%, a difference of 0.070%), Nicaraguan (1.1%, a difference of 0.17%), and Dominican (1.1%, a difference of 0.20%).
| Demographics | Rating | Rank | Disability Age Under 5 |
| Immigrants from Moldova | 96.8 /100 | #95 | Exceptional 1.1% |
| Mongolians | 96.6 /100 | #96 | Exceptional 1.1% |
| Immigrants from Iraq | 96.5 /100 | #97 | Exceptional 1.1% |
| Immigrants from South Eastern Asia | 96.5 /100 | #98 | Exceptional 1.1% |
| Dominicans | 96.3 /100 | #99 | Exceptional 1.1% |
| Nicaraguans | 96.3 /100 | #100 | Exceptional 1.1% |
| Immigrants from Uganda | 96.1 /100 | #101 | Exceptional 1.1% |
| Immigrants from Morocco | 96.0 /100 | #102 | Exceptional 1.2% |
| Immigrants from Nicaragua | 96.0 /100 | #103 | Exceptional 1.2% |
| Indonesians | 95.9 /100 | #104 | Exceptional 1.2% |
| Immigrants from South Africa | 95.6 /100 | #105 | Exceptional 1.2% |
| Cambodians | 95.4 /100 | #106 | Exceptional 1.2% |
| Immigrants from West Indies | 95.3 /100 | #107 | Exceptional 1.2% |
| Iraqis | 95.1 /100 | #108 | Exceptional 1.2% |
| Immigrants from Panama | 95.0 /100 | #109 | Exceptional 1.2% |
Immigrants from Morocco Disability Age Under 5 Correlation Summary
| Measurement | Immigrants from Morocco Data | Disability Age Under 5 Data |
| Minimum | 0.038% | 0.32% |
| Maximum | 3.0% | 7.4% |
| Range | 2.9% | 7.1% |
| Mean | 0.99% | 1.7% |
| Median | 0.79% | 1.4% |
| Interquartile 25% (IQ1) | 0.40% | 1.1% |
| Interquartile 75% (IQ3) | 1.2% | 1.8% |
| Interquartile Range (IQR) | 0.84% | 0.68% |
| Standard Deviation (Sample) | 0.85% | 1.6% |
| Standard Deviation (Population) | 0.82% | 1.6% |
Correlation Details
| Immigrants from Morocco Percentile | Sample Size | Disability Age Under 5 |
[ 0.0% - 0.5% ] 0.038% | 103,274,471 | 0.89% |
[ 0.0% - 0.5% ] 0.14% | 11,084,987 | 1.3% |
[ 0.0% - 0.5% ] 0.25% | 2,620,931 | 1.4% |
[ 0.0% - 0.5% ] 0.35% | 1,222,925 | 1.1% |
[ 0.0% - 0.5% ] 0.46% | 633,684 | 1.5% |
[ 0.5% - 1.0% ] 0.55% | 494,282 | 1.5% |
[ 0.5% - 1.0% ] 0.67% | 151,589 | 1.7% |
[ 0.5% - 1.0% ] 0.74% | 278,539 | 1.1% |
[ 0.5% - 1.0% ] 0.85% | 96,198 | 7.4% |
[ 0.5% - 1.0% ] 0.93% | 86,647 | 1.8% |
[ 1.0% - 1.5% ] 1.04% | 77,144 | 0.32% |
[ 1.0% - 1.5% ] 1.12% | 61,282 | 2.0% |
[ 1.0% - 1.5% ] 1.36% | 37,632 | 1.7% |
[ 1.5% - 2.0% ] 1.70% | 121,169 | 0.37% |
[ 2.5% - 3.0% ] 2.69% | 10,591 | 1.9% |
[ 2.5% - 3.0% ] 2.98% | 19,531 | 1.2% |