American Disability Age Under 5
COMPARE
American
Select to Compare
Disability Age Under 5
American Disability Age Under 5
1.9%
DISABILITY | AGE UNDER 5
0.0/ 100
METRIC RATING
328th/ 347
METRIC RANK
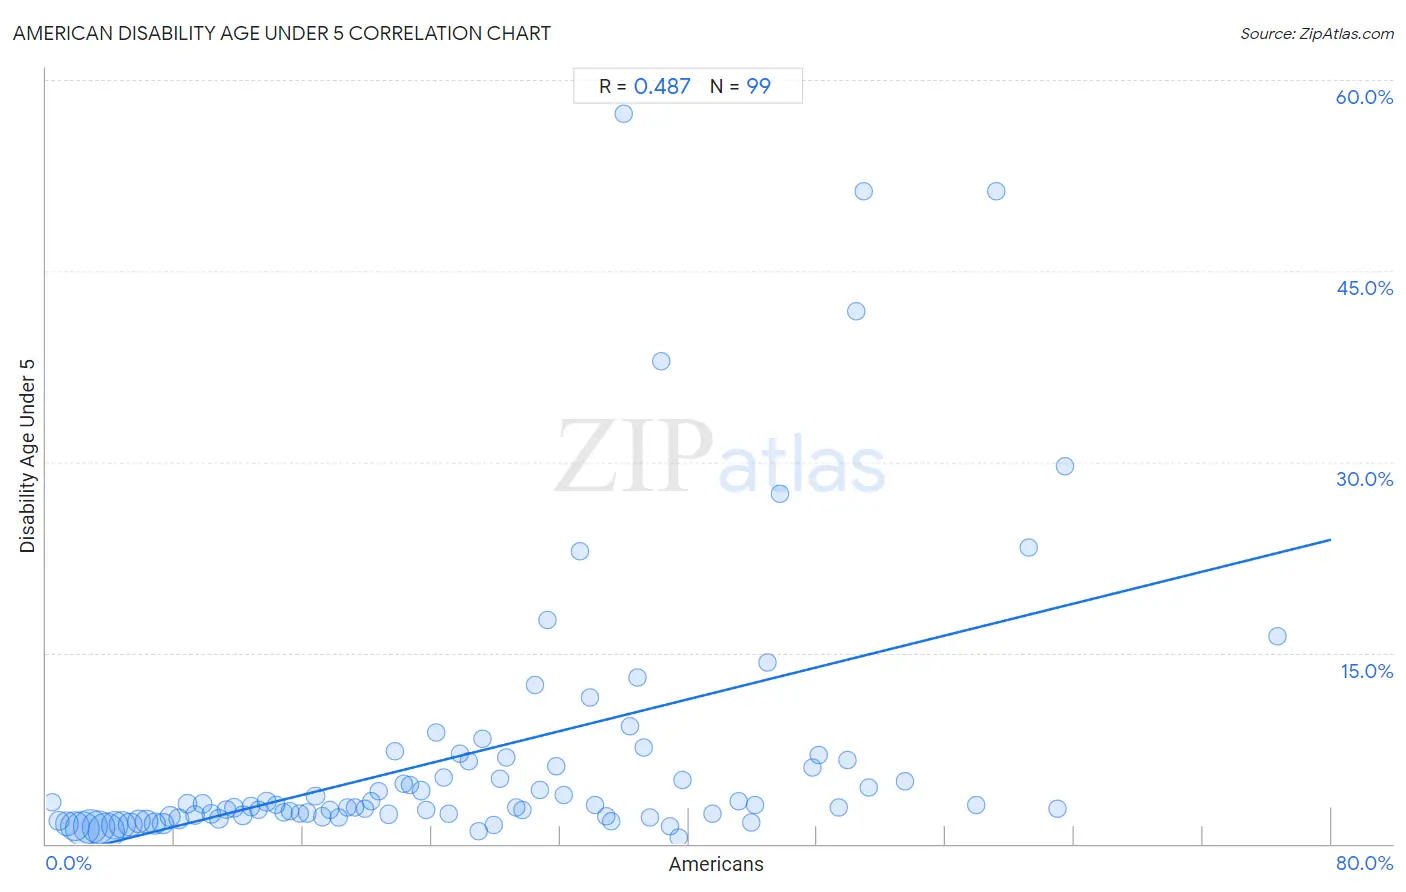
American Disability Age Under 5 Correlation Chart
The statistical analysis conducted on geographies consisting of 262,372,368 people shows a moderate positive correlation between the proportion of Americans and percentage of population with a disability under the age of 5 in the United States with a correlation coefficient (R) of 0.487 and weighted average of 1.9%. On average, for every 1% (one percent) increase in Americans within a typical geography, there is an increase of 0.31% in percentage of population with a disability under the age of 5.
It is essential to understand that the correlation between the percentage of Americans and percentage of population with a disability under the age of 5 does not imply a direct cause-and-effect relationship. It remains uncertain whether the presence of Americans influences an upward or downward trend in the level of percentage of population with a disability under the age of 5 within an area, or if Americans simply ended up residing in those areas with higher or lower levels of percentage of population with a disability under the age of 5 due to other factors.
Demographics Similar to Americans by Disability Age Under 5
In terms of disability age under 5, the demographic groups most similar to Americans are Houma (1.9%, a difference of 0.47%), Choctaw (1.9%, a difference of 0.80%), French Canadian (1.9%, a difference of 1.1%), Chippewa (1.9%, a difference of 1.2%), and Osage (1.8%, a difference of 1.7%).
| Demographics | Rating | Rank | Disability Age Under 5 |
| Ottawa | 0.0 /100 | #321 | Tragic 1.7% |
| Germans | 0.0 /100 | #322 | Tragic 1.7% |
| Chickasaw | 0.0 /100 | #323 | Tragic 1.7% |
| Cherokee | 0.0 /100 | #324 | Tragic 1.8% |
| Immigrants from Portugal | 0.0 /100 | #325 | Tragic 1.8% |
| Sioux | 0.0 /100 | #326 | Tragic 1.8% |
| Osage | 0.0 /100 | #327 | Tragic 1.8% |
| Americans | 0.0 /100 | #328 | Tragic 1.9% |
| Houma | 0.0 /100 | #329 | Tragic 1.9% |
| Choctaw | 0.0 /100 | #330 | Tragic 1.9% |
| French Canadians | 0.0 /100 | #331 | Tragic 1.9% |
| Chippewa | 0.0 /100 | #332 | Tragic 1.9% |
| Dutch West Indians | 0.0 /100 | #333 | Tragic 1.9% |
| Natives/Alaskans | 0.0 /100 | #334 | Tragic 1.9% |
| Pennsylvania Germans | 0.0 /100 | #335 | Tragic 1.9% |
American Disability Age Under 5 Correlation Summary
| Measurement | American Data | Disability Age Under 5 Data |
| Minimum | 0.39% | 0.45% |
| Maximum | 76.7% | 57.3% |
| Range | 76.3% | 56.8% |
| Mean | 26.4% | 7.1% |
| Median | 24.7% | 2.9% |
| Interquartile 25% (IQ1) | 12.2% | 2.1% |
| Interquartile 75% (IQ3) | 37.6% | 6.5% |
| Interquartile Range (IQR) | 25.4% | 4.3% |
| Standard Deviation (Sample) | 17.1% | 11.0% |
| Standard Deviation (Population) | 17.1% | 11.0% |
Correlation Details
| American Percentile | Sample Size | Disability Age Under 5 |
[ 0.0% - 0.5% ] 0.39% | 712,705 | 3.2% |
[ 0.5% - 1.0% ] 0.79% | 3,738,166 | 1.8% |
[ 1.0% - 1.5% ] 1.29% | 11,176,965 | 1.6% |
[ 1.5% - 2.0% ] 1.76% | 20,632,469 | 1.4% |
[ 2.0% - 2.5% ] 2.25% | 30,030,635 | 1.2% |
[ 2.5% - 3.0% ] 2.76% | 28,380,892 | 1.4% |
[ 3.0% - 3.5% ] 3.24% | 28,244,518 | 1.3% |
[ 3.5% - 4.0% ] 3.76% | 34,017,613 | 1.0% |
[ 4.0% - 4.5% ] 4.24% | 17,125,359 | 1.4% |
[ 4.5% - 5.0% ] 4.74% | 16,702,115 | 1.5% |
[ 5.0% - 5.5% ] 5.25% | 10,319,877 | 1.5% |
[ 5.5% - 6.0% ] 5.77% | 8,417,023 | 1.7% |
[ 6.0% - 6.5% ] 6.23% | 7,870,517 | 1.7% |
[ 6.5% - 7.0% ] 6.76% | 7,231,232 | 1.6% |
[ 7.0% - 7.5% ] 7.26% | 5,303,786 | 1.6% |
[ 7.5% - 8.0% ] 7.71% | 4,032,167 | 2.2% |
[ 8.0% - 8.5% ] 8.29% | 4,047,774 | 2.0% |
[ 8.5% - 9.0% ] 8.76% | 2,382,717 | 3.1% |
[ 9.0% - 9.5% ] 9.25% | 2,201,450 | 2.3% |
[ 9.5% - 10.0% ] 9.75% | 2,036,338 | 3.1% |
[ 10.0% - 10.5% ] 10.25% | 1,989,431 | 2.3% |
[ 10.5% - 11.0% ] 10.72% | 1,908,584 | 1.9% |
[ 11.0% - 11.5% ] 11.24% | 1,383,342 | 2.7% |
[ 11.5% - 12.0% ] 11.69% | 1,351,927 | 2.8% |
[ 12.0% - 12.5% ] 12.22% | 974,656 | 2.2% |
[ 12.5% - 13.0% ] 12.75% | 1,085,923 | 2.9% |
[ 13.0% - 13.5% ] 13.23% | 738,967 | 2.7% |
[ 13.5% - 14.0% ] 13.73% | 672,833 | 3.3% |
[ 14.0% - 14.5% ] 14.30% | 557,198 | 3.1% |
[ 14.5% - 15.0% ] 14.77% | 532,221 | 2.5% |
[ 15.0% - 15.5% ] 15.19% | 415,901 | 2.6% |
[ 15.5% - 16.0% ] 15.80% | 836,600 | 2.4% |
[ 16.0% - 16.5% ] 16.23% | 561,812 | 2.4% |
[ 16.5% - 17.0% ] 16.77% | 468,040 | 3.7% |
[ 17.0% - 17.5% ] 17.21% | 566,021 | 2.1% |
[ 17.5% - 18.0% ] 17.65% | 363,942 | 2.7% |
[ 18.0% - 18.5% ] 18.20% | 237,423 | 2.1% |
[ 18.5% - 19.0% ] 18.77% | 198,251 | 2.9% |
[ 19.0% - 19.5% ] 19.20% | 184,801 | 2.8% |
[ 19.5% - 20.0% ] 19.82% | 255,452 | 2.7% |
[ 20.0% - 20.5% ] 20.23% | 120,390 | 3.4% |
[ 20.5% - 21.0% ] 20.73% | 135,414 | 4.1% |
[ 21.0% - 21.5% ] 21.31% | 348,948 | 2.3% |
[ 21.5% - 22.0% ] 21.73% | 126,438 | 7.2% |
[ 22.0% - 22.5% ] 22.22% | 37,226 | 4.7% |
[ 22.5% - 23.0% ] 22.65% | 134,277 | 4.7% |
[ 23.0% - 23.5% ] 23.32% | 122,419 | 4.2% |
[ 23.5% - 24.0% ] 23.69% | 83,439 | 2.7% |
[ 24.0% - 24.5% ] 24.31% | 48,399 | 8.8% |
[ 24.5% - 25.0% ] 24.71% | 87,264 | 5.2% |
[ 25.0% - 25.5% ] 25.09% | 61,207 | 2.3% |
[ 25.5% - 26.0% ] 25.76% | 38,860 | 7.0% |
[ 26.0% - 26.5% ] 26.31% | 35,611 | 6.5% |
[ 26.5% - 27.0% ] 26.90% | 236,472 | 1.0% |
[ 27.0% - 27.5% ] 27.20% | 58,406 | 8.2% |
[ 27.5% - 28.0% ] 27.84% | 78,362 | 1.4% |
[ 28.0% - 28.5% ] 28.27% | 64,438 | 5.1% |
[ 28.5% - 29.0% ] 28.65% | 21,367 | 6.7% |
[ 29.0% - 29.5% ] 29.27% | 61,953 | 2.9% |
[ 29.5% - 30.0% ] 29.67% | 87,038 | 2.6% |
[ 30.0% - 30.5% ] 30.46% | 11,018 | 12.5% |
[ 30.5% - 31.0% ] 30.75% | 117,950 | 4.2% |
[ 31.0% - 31.5% ] 31.23% | 15,314 | 17.6% |
[ 31.5% - 32.0% ] 31.73% | 27,026 | 6.0% |
[ 32.0% - 32.5% ] 32.24% | 49,029 | 3.8% |
[ 33.0% - 33.5% ] 33.22% | 5,374 | 23.0% |
[ 33.5% - 34.0% ] 33.85% | 7,417 | 11.4% |
[ 34.0% - 34.5% ] 34.19% | 16,537 | 3.1% |
[ 34.5% - 35.0% ] 34.84% | 34,183 | 2.2% |
[ 35.0% - 35.5% ] 35.14% | 6,935 | 1.7% |
[ 35.5% - 36.0% ] 35.97% | 1,429 | 57.3% |
[ 36.0% - 36.5% ] 36.35% | 8,866 | 9.2% |
[ 36.5% - 37.0% ] 36.84% | 13,365 | 13.0% |
[ 37.0% - 37.5% ] 37.24% | 11,169 | 7.6% |
[ 37.5% - 38.0% ] 37.62% | 41,895 | 2.0% |
[ 38.0% - 38.5% ] 38.30% | 282 | 37.9% |
[ 38.5% - 39.0% ] 38.85% | 7,020 | 1.4% |
[ 39.0% - 39.5% ] 39.35% | 39,497 | 0.45% |
[ 39.5% - 40.0% ] 39.60% | 447 | 5.0% |
[ 41.0% - 41.5% ] 41.44% | 6,889 | 2.3% |
[ 43.0% - 43.5% ] 43.08% | 6,152 | 3.3% |
[ 43.5% - 44.0% ] 43.88% | 27,959 | 1.7% |
[ 44.0% - 44.5% ] 44.11% | 1,866 | 3.1% |
[ 44.5% - 45.0% ] 44.91% | 6,052 | 14.3% |
[ 45.5% - 46.0% ] 45.71% | 105 | 27.5% |
[ 47.5% - 48.0% ] 47.67% | 5,204 | 6.0% |
[ 48.0% - 48.5% ] 48.13% | 3,788 | 7.0% |
[ 49.0% - 49.5% ] 49.32% | 951 | 2.8% |
[ 49.5% - 50.0% ] 49.90% | 4,495 | 6.6% |
[ 50.0% - 50.5% ] 50.46% | 2,085 | 41.9% |
[ 50.5% - 51.0% ] 50.90% | 666 | 51.3% |
[ 51.0% - 51.5% ] 51.21% | 2,511 | 4.4% |
[ 53.0% - 53.5% ] 53.47% | 7,501 | 4.9% |
[ 57.5% - 58.0% ] 57.91% | 411 | 3.1% |
[ 59.0% - 59.5% ] 59.16% | 573 | 51.3% |
[ 61.0% - 61.5% ] 61.13% | 705 | 23.3% |
[ 62.5% - 63.0% ] 62.97% | 2,471 | 2.7% |
[ 63.0% - 63.5% ] 63.45% | 777 | 29.6% |
[ 76.5% - 77.0% ] 76.67% | 883 | 16.3% |