Korean Disability Age Under 5
COMPARE
Korean
Select to Compare
Disability Age Under 5
Korean Disability Age Under 5
1.2%
DISABILITY | AGE UNDER 5
87.7/ 100
METRIC RATING
130th/ 347
METRIC RANK
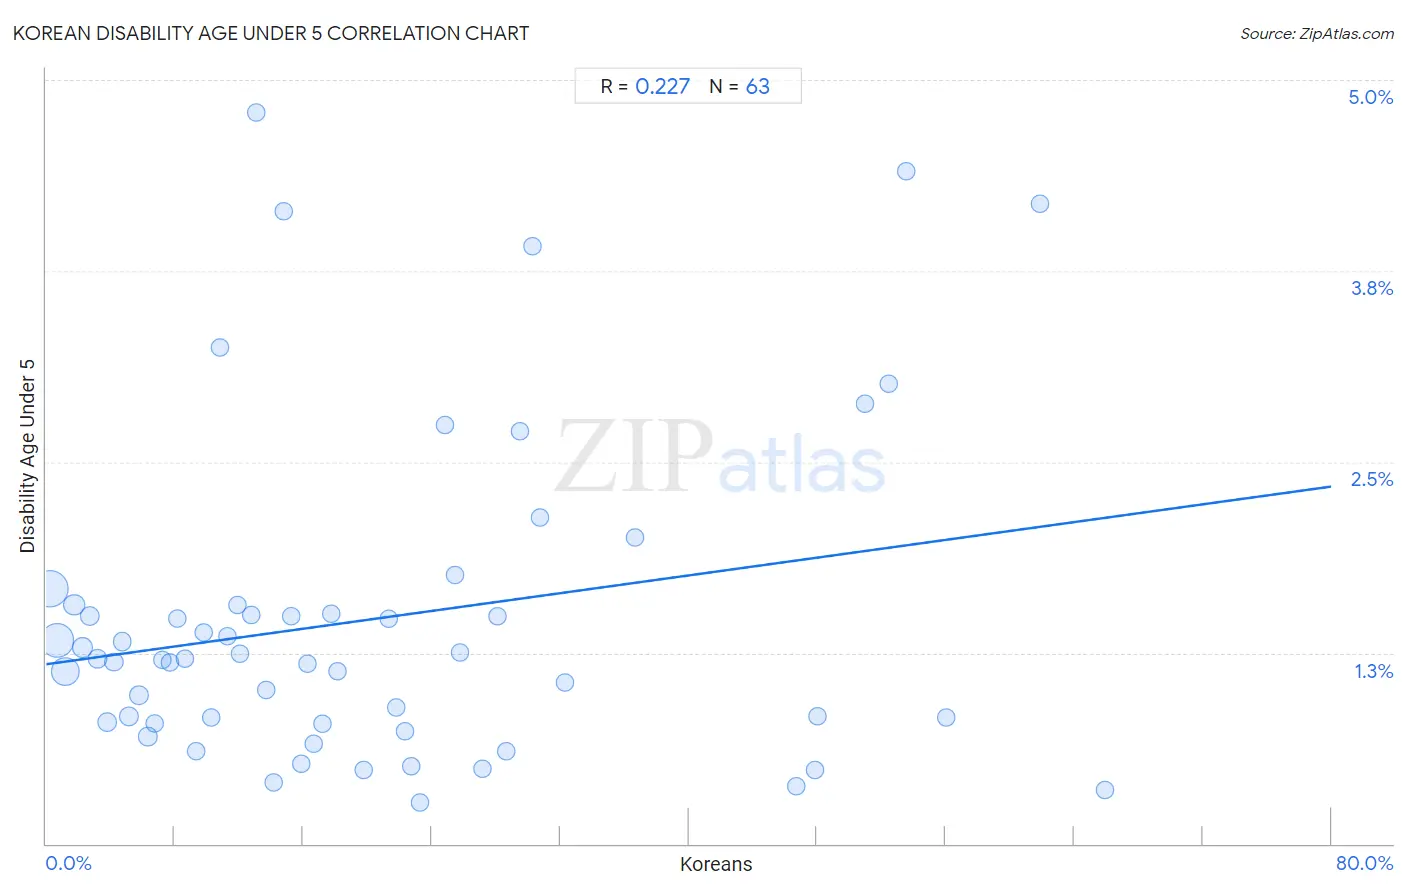
Korean Disability Age Under 5 Correlation Chart
The statistical analysis conducted on geographies consisting of 251,527,080 people shows a weak positive correlation between the proportion of Koreans and percentage of population with a disability under the age of 5 in the United States with a correlation coefficient (R) of 0.227 and weighted average of 1.2%. On average, for every 1% (one percent) increase in Koreans within a typical geography, there is an increase of 0.015% in percentage of population with a disability under the age of 5.
It is essential to understand that the correlation between the percentage of Koreans and percentage of population with a disability under the age of 5 does not imply a direct cause-and-effect relationship. It remains uncertain whether the presence of Koreans influences an upward or downward trend in the level of percentage of population with a disability under the age of 5 within an area, or if Koreans simply ended up residing in those areas with higher or lower levels of percentage of population with a disability under the age of 5 due to other factors.
Demographics Similar to Koreans by Disability Age Under 5
In terms of disability age under 5, the demographic groups most similar to Koreans are Immigrants from Serbia (1.2%, a difference of 0.020%), Immigrants (1.2%, a difference of 0.080%), Immigrants from Eastern Europe (1.2%, a difference of 0.090%), Immigrants from Romania (1.2%, a difference of 0.17%), and Immigrants from France (1.2%, a difference of 0.17%).
| Demographics | Rating | Rank | Disability Age Under 5 |
| Zimbabweans | 90.6 /100 | #123 | Exceptional 1.2% |
| Immigrants from Cambodia | 90.5 /100 | #124 | Exceptional 1.2% |
| Japanese | 90.3 /100 | #125 | Exceptional 1.2% |
| Central Americans | 89.7 /100 | #126 | Excellent 1.2% |
| Immigrants from Romania | 88.4 /100 | #127 | Excellent 1.2% |
| Immigrants from France | 88.4 /100 | #128 | Excellent 1.2% |
| Immigrants | 88.0 /100 | #129 | Excellent 1.2% |
| Koreans | 87.7 /100 | #130 | Excellent 1.2% |
| Immigrants from Serbia | 87.6 /100 | #131 | Excellent 1.2% |
| Immigrants from Eastern Europe | 87.3 /100 | #132 | Excellent 1.2% |
| Immigrants from Spain | 86.5 /100 | #133 | Excellent 1.2% |
| Argentineans | 85.7 /100 | #134 | Excellent 1.2% |
| Fijians | 84.7 /100 | #135 | Excellent 1.2% |
| Moroccans | 83.6 /100 | #136 | Excellent 1.2% |
| Immigrants from Eastern Africa | 83.1 /100 | #137 | Excellent 1.2% |
Korean Disability Age Under 5 Correlation Summary
| Measurement | Korean Data | Disability Age Under 5 Data |
| Minimum | 0.27% | 0.27% |
| Maximum | 65.9% | 4.8% |
| Range | 65.6% | 4.5% |
| Mean | 20.2% | 1.5% |
| Median | 15.9% | 1.2% |
| Interquartile 25% (IQ1) | 7.7% | 0.79% |
| Interquartile 75% (IQ3) | 28.1% | 1.6% |
| Interquartile Range (IQR) | 20.3% | 0.77% |
| Standard Deviation (Sample) | 16.5% | 1.1% |
| Standard Deviation (Population) | 16.4% | 1.1% |
Correlation Details
| Korean Percentile | Sample Size | Disability Age Under 5 |
[ 0.0% - 0.5% ] 0.27% | 78,154,892 | 1.7% |
[ 0.5% - 1.0% ] 0.70% | 64,598,307 | 1.3% |
[ 1.0% - 1.5% ] 1.20% | 38,987,076 | 1.1% |
[ 1.5% - 2.0% ] 1.73% | 11,763,724 | 1.6% |
[ 2.0% - 2.5% ] 2.28% | 10,169,743 | 1.3% |
[ 2.5% - 3.0% ] 2.72% | 7,065,366 | 1.5% |
[ 3.0% - 3.5% ] 3.21% | 4,977,239 | 1.2% |
[ 3.5% - 4.0% ] 3.80% | 8,221,779 | 0.80% |
[ 4.0% - 4.5% ] 4.18% | 4,022,845 | 1.2% |
[ 4.5% - 5.0% ] 4.73% | 2,192,179 | 1.3% |
[ 5.0% - 5.5% ] 5.17% | 3,718,937 | 0.83% |
[ 5.5% - 6.0% ] 5.77% | 3,490,770 | 0.97% |
[ 6.0% - 6.5% ] 6.33% | 2,201,917 | 0.70% |
[ 6.5% - 7.0% ] 6.74% | 2,764,785 | 0.79% |
[ 7.0% - 7.5% ] 7.20% | 999,168 | 1.2% |
[ 7.5% - 8.0% ] 7.73% | 558,436 | 1.2% |
[ 8.0% - 8.5% ] 8.17% | 1,414,888 | 1.5% |
[ 8.5% - 9.0% ] 8.64% | 650,888 | 1.2% |
[ 9.0% - 9.5% ] 9.32% | 824,875 | 0.61% |
[ 9.5% - 10.0% ] 9.78% | 345,165 | 1.4% |
[ 10.0% - 10.5% ] 10.31% | 187,801 | 0.82% |
[ 10.5% - 11.0% ] 10.80% | 225,515 | 3.3% |
[ 11.0% - 11.5% ] 11.26% | 344,210 | 1.4% |
[ 11.5% - 12.0% ] 11.89% | 217,997 | 1.6% |
[ 12.0% - 12.5% ] 12.08% | 155,841 | 1.2% |
[ 12.5% - 13.0% ] 12.74% | 216,290 | 1.5% |
[ 13.0% - 13.5% ] 13.09% | 69,832 | 4.8% |
[ 13.5% - 14.0% ] 13.68% | 285,943 | 1.0% |
[ 14.0% - 14.5% ] 14.19% | 434,588 | 0.40% |
[ 14.5% - 15.0% ] 14.80% | 81,448 | 4.1% |
[ 15.0% - 15.5% ] 15.26% | 254,210 | 1.5% |
[ 15.5% - 16.0% ] 15.87% | 55,888 | 0.52% |
[ 16.0% - 16.5% ] 16.25% | 92,489 | 1.2% |
[ 16.5% - 17.0% ] 16.66% | 57,844 | 0.66% |
[ 17.0% - 17.5% ] 17.18% | 91,838 | 0.79% |
[ 17.5% - 18.0% ] 17.71% | 43,702 | 1.5% |
[ 18.0% - 18.5% ] 18.16% | 2,902 | 1.1% |
[ 19.5% - 20.0% ] 19.74% | 399,914 | 0.48% |
[ 21.0% - 21.5% ] 21.29% | 57,938 | 1.5% |
[ 21.5% - 22.0% ] 21.77% | 125,531 | 0.89% |
[ 22.0% - 22.5% ] 22.33% | 141,788 | 0.74% |
[ 22.5% - 23.0% ] 22.69% | 78,111 | 0.51% |
[ 23.0% - 23.5% ] 23.27% | 14,310 | 0.27% |
[ 24.5% - 25.0% ] 24.84% | 33,700 | 2.7% |
[ 25.0% - 25.5% ] 25.41% | 21,546 | 1.8% |
[ 25.5% - 26.0% ] 25.74% | 42,778 | 1.3% |
[ 27.0% - 27.5% ] 27.14% | 46,812 | 0.49% |
[ 28.0% - 28.5% ] 28.06% | 59,026 | 1.5% |
[ 28.5% - 29.0% ] 28.65% | 38,674 | 0.60% |
[ 29.5% - 30.0% ] 29.53% | 54,362 | 2.7% |
[ 30.0% - 30.5% ] 30.27% | 27,423 | 3.9% |
[ 30.5% - 31.0% ] 30.70% | 34,930 | 2.1% |
[ 32.0% - 32.5% ] 32.26% | 49,623 | 1.1% |
[ 36.5% - 37.0% ] 36.62% | 22,701 | 2.0% |
[ 46.5% - 47.0% ] 46.66% | 52,328 | 0.37% |
[ 47.5% - 48.0% ] 47.85% | 82,504 | 0.49% |
[ 48.0% - 48.5% ] 48.05% | 17,604 | 0.83% |
[ 51.0% - 51.5% ] 51.00% | 27,233 | 2.9% |
[ 52.0% - 52.5% ] 52.44% | 25,902 | 3.0% |
[ 53.5% - 54.0% ] 53.57% | 13,919 | 4.4% |
[ 56.0% - 56.5% ] 56.07% | 72,605 | 0.83% |
[ 61.5% - 62.0% ] 61.91% | 4,628 | 4.2% |
[ 65.5% - 66.0% ] 65.90% | 39,873 | 0.35% |