Immigrants from El Salvador Disability Age Under 5
COMPARE
Immigrants from El Salvador
Select to Compare
Disability Age Under 5
Immigrants from El Salvador Disability Age Under 5
1.1%
DISABILITY | AGE UNDER 5
99.6/ 100
METRIC RATING
54th/ 347
METRIC RANK
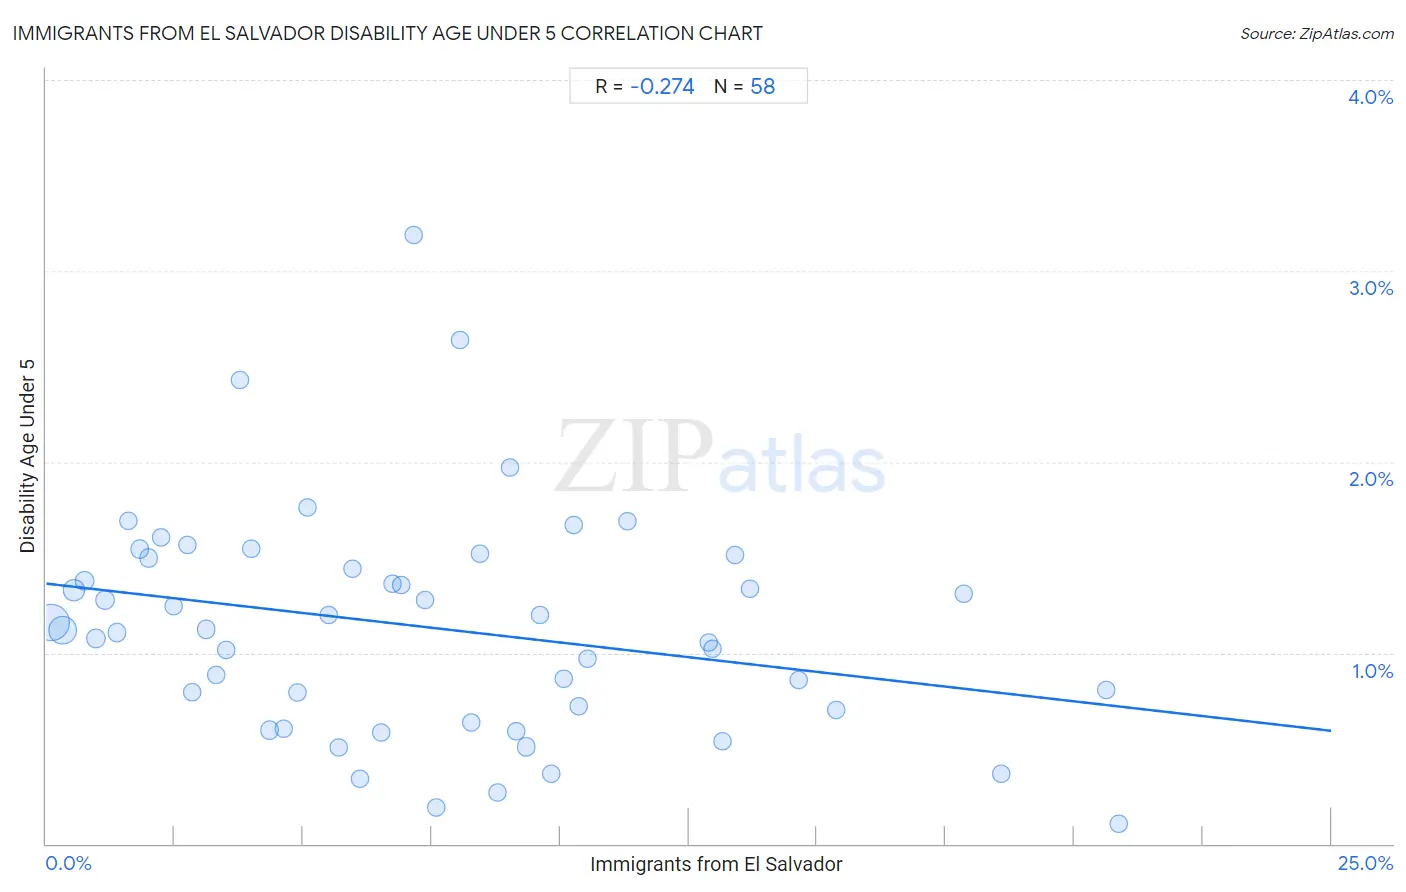
Immigrants from El Salvador Disability Age Under 5 Correlation Chart
The statistical analysis conducted on geographies consisting of 204,380,401 people shows a weak negative correlation between the proportion of Immigrants from El Salvador and percentage of population with a disability under the age of 5 in the United States with a correlation coefficient (R) of -0.274 and weighted average of 1.1%. On average, for every 1% (one percent) increase in Immigrants from El Salvador within a typical geography, there is a decrease of 0.031% in percentage of population with a disability under the age of 5.
It is essential to understand that the correlation between the percentage of Immigrants from El Salvador and percentage of population with a disability under the age of 5 does not imply a direct cause-and-effect relationship. It remains uncertain whether the presence of Immigrants from El Salvador influences an upward or downward trend in the level of percentage of population with a disability under the age of 5 within an area, or if Immigrants from El Salvador simply ended up residing in those areas with higher or lower levels of percentage of population with a disability under the age of 5 due to other factors.
Demographics Similar to Immigrants from El Salvador by Disability Age Under 5
In terms of disability age under 5, the demographic groups most similar to Immigrants from El Salvador are Salvadoran (1.1%, a difference of 0.090%), Asian (1.1%, a difference of 0.29%), Ecuadorian (1.1%, a difference of 0.49%), Assyrian/Chaldean/Syriac (1.1%, a difference of 0.52%), and Immigrants from Bolivia (1.1%, a difference of 0.60%).
| Demographics | Rating | Rank | Disability Age Under 5 |
| Immigrants from Sweden | 99.8 /100 | #47 | Exceptional 1.1% |
| Immigrants from Singapore | 99.7 /100 | #48 | Exceptional 1.1% |
| Immigrants from Russia | 99.7 /100 | #49 | Exceptional 1.1% |
| Immigrants from Japan | 99.7 /100 | #50 | Exceptional 1.1% |
| Immigrants from Kazakhstan | 99.7 /100 | #51 | Exceptional 1.1% |
| Immigrants from Bolivia | 99.6 /100 | #52 | Exceptional 1.1% |
| Asians | 99.6 /100 | #53 | Exceptional 1.1% |
| Immigrants from El Salvador | 99.6 /100 | #54 | Exceptional 1.1% |
| Salvadorans | 99.5 /100 | #55 | Exceptional 1.1% |
| Ecuadorians | 99.5 /100 | #56 | Exceptional 1.1% |
| Assyrians/Chaldeans/Syriacs | 99.5 /100 | #57 | Exceptional 1.1% |
| Immigrants from Egypt | 99.4 /100 | #58 | Exceptional 1.1% |
| Immigrants from Malaysia | 99.4 /100 | #59 | Exceptional 1.1% |
| Immigrants from Western Asia | 99.2 /100 | #60 | Exceptional 1.1% |
| Immigrants from Ethiopia | 99.2 /100 | #61 | Exceptional 1.1% |
Immigrants from El Salvador Disability Age Under 5 Correlation Summary
| Measurement | Immigrants from El Salvador Data | Disability Age Under 5 Data |
| Minimum | 0.095% | 0.10% |
| Maximum | 20.9% | 3.2% |
| Range | 20.8% | 3.1% |
| Mean | 7.4% | 1.1% |
| Median | 6.8% | 1.1% |
| Interquartile 25% (IQ1) | 3.1% | 0.70% |
| Interquartile 75% (IQ3) | 10.3% | 1.5% |
| Interquartile Range (IQR) | 7.1% | 0.80% |
| Standard Deviation (Sample) | 5.2% | 0.59% |
| Standard Deviation (Population) | 5.2% | 0.58% |
Correlation Details
| Immigrants from El Salvador Percentile | Sample Size | Disability Age Under 5 |
[ 0.0% - 0.5% ] 0.095% | 88,582,436 | 1.2% |
[ 0.0% - 0.5% ] 0.32% | 45,552,210 | 1.1% |
[ 0.5% - 1.0% ] 0.53% | 15,738,440 | 1.3% |
[ 0.5% - 1.0% ] 0.75% | 10,024,438 | 1.4% |
[ 0.5% - 1.0% ] 0.96% | 8,933,147 | 1.1% |
[ 1.0% - 1.5% ] 1.15% | 5,803,920 | 1.3% |
[ 1.0% - 1.5% ] 1.38% | 5,271,660 | 1.1% |
[ 1.5% - 2.0% ] 1.59% | 3,604,076 | 1.7% |
[ 1.5% - 2.0% ] 1.82% | 2,466,404 | 1.5% |
[ 1.5% - 2.0% ] 2.00% | 1,153,572 | 1.5% |
[ 2.0% - 2.5% ] 2.23% | 1,325,129 | 1.6% |
[ 2.0% - 2.5% ] 2.47% | 972,697 | 1.2% |
[ 2.5% - 3.0% ] 2.74% | 493,578 | 1.6% |
[ 2.5% - 3.0% ] 2.84% | 3,003,035 | 0.79% |
[ 3.0% - 3.5% ] 3.11% | 571,088 | 1.1% |
[ 3.0% - 3.5% ] 3.30% | 727,884 | 0.88% |
[ 3.5% - 4.0% ] 3.51% | 649,691 | 1.0% |
[ 3.5% - 4.0% ] 3.77% | 443,926 | 2.4% |
[ 3.5% - 4.0% ] 3.99% | 213,157 | 1.5% |
[ 4.0% - 4.5% ] 4.34% | 4,138,119 | 0.59% |
[ 4.5% - 5.0% ] 4.62% | 505,055 | 0.60% |
[ 4.5% - 5.0% ] 4.88% | 380,887 | 0.79% |
[ 5.0% - 5.5% ] 5.07% | 255,255 | 1.8% |
[ 5.0% - 5.5% ] 5.49% | 352,715 | 1.2% |
[ 5.5% - 6.0% ] 5.69% | 117,405 | 0.50% |
[ 5.5% - 6.0% ] 5.95% | 62,828 | 1.4% |
[ 6.0% - 6.5% ] 6.10% | 92,643 | 0.34% |
[ 6.5% - 7.0% ] 6.52% | 371,202 | 0.58% |
[ 6.5% - 7.0% ] 6.74% | 230,342 | 1.4% |
[ 6.5% - 7.0% ] 6.91% | 31,165 | 1.4% |
[ 7.0% - 7.5% ] 7.15% | 48,431 | 3.2% |
[ 7.0% - 7.5% ] 7.37% | 132,563 | 1.3% |
[ 7.5% - 8.0% ] 7.59% | 144,493 | 0.19% |
[ 8.0% - 8.5% ] 8.05% | 64,612 | 2.6% |
[ 8.0% - 8.5% ] 8.26% | 268,547 | 0.64% |
[ 8.0% - 8.5% ] 8.44% | 49,498 | 1.5% |
[ 8.5% - 9.0% ] 8.77% | 67,937 | 0.27% |
[ 9.0% - 9.5% ] 9.02% | 75,024 | 2.0% |
[ 9.0% - 9.5% ] 9.13% | 155,953 | 0.59% |
[ 9.0% - 9.5% ] 9.34% | 243,066 | 0.51% |
[ 9.5% - 10.0% ] 9.60% | 48,617 | 1.2% |
[ 9.5% - 10.0% ] 9.83% | 121,169 | 0.37% |
[ 10.0% - 10.5% ] 10.06% | 59,465 | 0.86% |
[ 10.0% - 10.5% ] 10.25% | 32,522 | 1.7% |
[ 10.0% - 10.5% ] 10.37% | 56,628 | 0.72% |
[ 10.5% - 11.0% ] 10.53% | 69,064 | 0.97% |
[ 11.0% - 11.5% ] 11.30% | 128,597 | 1.7% |
[ 12.5% - 13.0% ] 12.88% | 20,851 | 1.1% |
[ 12.5% - 13.0% ] 12.97% | 60,668 | 1.0% |
[ 13.0% - 13.5% ] 13.15% | 42,310 | 0.53% |
[ 13.0% - 13.5% ] 13.40% | 120,534 | 1.5% |
[ 13.5% - 14.0% ] 13.69% | 22,966 | 1.3% |
[ 14.5% - 15.0% ] 14.64% | 56,319 | 0.86% |
[ 15.0% - 15.5% ] 15.36% | 34,625 | 0.70% |
[ 17.5% - 18.0% ] 17.84% | 21,778 | 1.3% |
[ 18.5% - 19.0% ] 18.58% | 79,765 | 0.36% |
[ 20.5% - 21.0% ] 20.62% | 50,387 | 0.81% |
[ 20.5% - 21.0% ] 20.87% | 35,908 | 0.10% |