Immigrants from Singapore Disability Age Under 5
COMPARE
Immigrants from Singapore
Select to Compare
Disability Age Under 5
Immigrants from Singapore Disability Age Under 5
1.1%
DISABILITY | AGE UNDER 5
99.7/ 100
METRIC RATING
48th/ 347
METRIC RANK
Immigrants from Singapore Disability Age Under 5 Correlation Chart
The statistical analysis conducted on geographies consisting of 97,565,040 people shows a moderate positive correlation between the proportion of Immigrants from Singapore and percentage of population with a disability under the age of 5 in the United States with a correlation coefficient (R) of 0.450 and weighted average of 1.1%. On average, for every 1% (one percent) increase in Immigrants from Singapore within a typical geography, there is an increase of 2.0% in percentage of population with a disability under the age of 5.
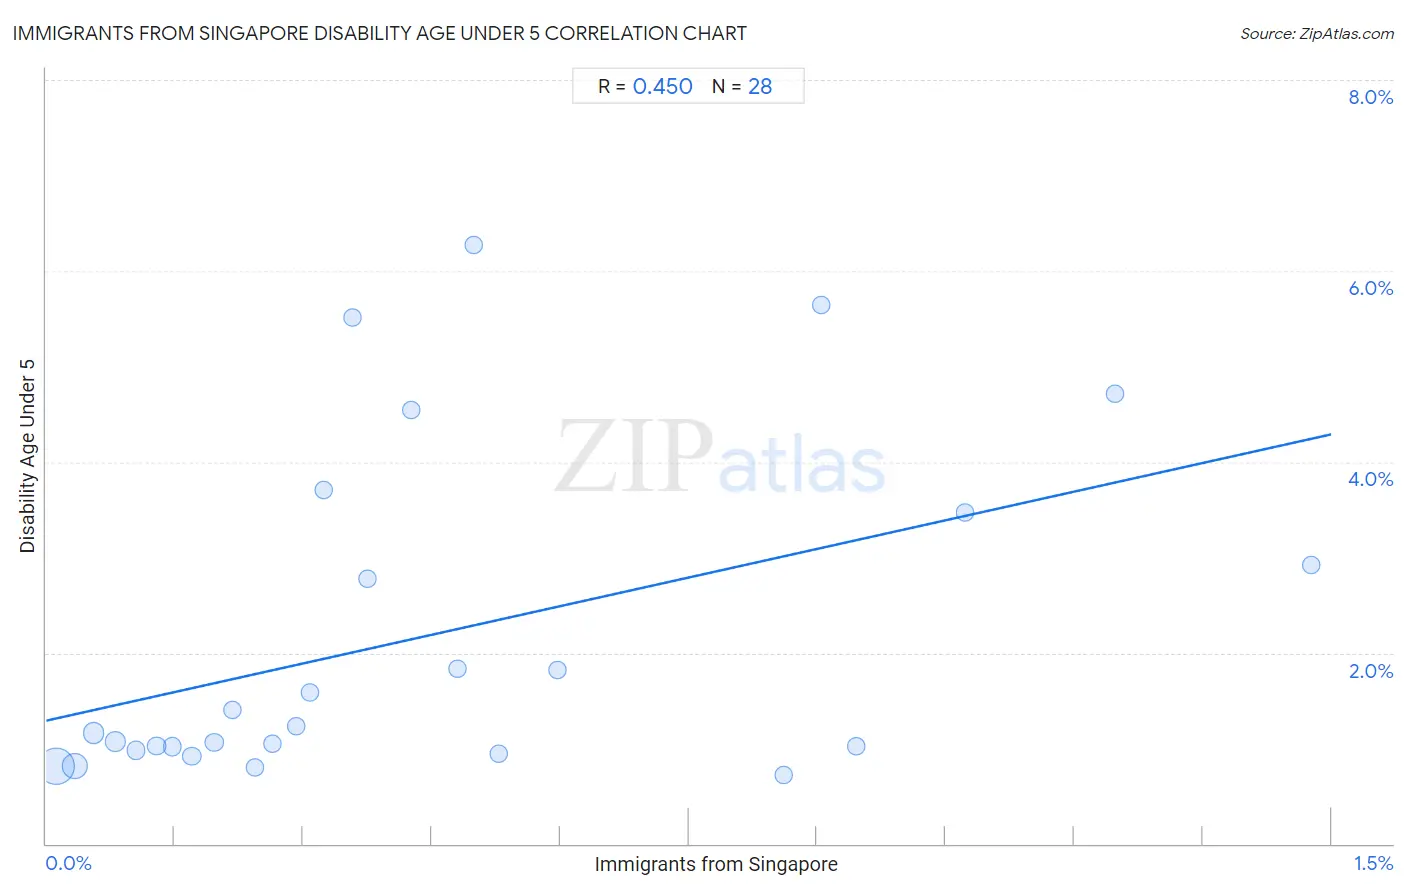
It is essential to understand that the correlation between the percentage of Immigrants from Singapore and percentage of population with a disability under the age of 5 does not imply a direct cause-and-effect relationship. It remains uncertain whether the presence of Immigrants from Singapore influences an upward or downward trend in the level of percentage of population with a disability under the age of 5 within an area, or if Immigrants from Singapore simply ended up residing in those areas with higher or lower levels of percentage of population with a disability under the age of 5 due to other factors.
Demographics Similar to Immigrants from Singapore by Disability Age Under 5
In terms of disability age under 5, the demographic groups most similar to Immigrants from Singapore are Immigrants from Russia (1.1%, a difference of 0.21%), Immigrants from Sweden (1.1%, a difference of 0.22%), Immigrants from Japan (1.1%, a difference of 0.22%), Immigrants from Congo (1.1%, a difference of 0.36%), and Immigrants from Kazakhstan (1.1%, a difference of 0.41%).
| Demographics | Rating | Rank | Disability Age Under 5 |
| Thais | 99.8 /100 | #41 | Exceptional 1.1% |
| Immigrants from Bulgaria | 99.8 /100 | #42 | Exceptional 1.1% |
| Pima | 99.8 /100 | #43 | Exceptional 1.1% |
| Immigrants from Asia | 99.8 /100 | #44 | Exceptional 1.1% |
| Immigrants from Turkey | 99.8 /100 | #45 | Exceptional 1.1% |
| Immigrants from Congo | 99.8 /100 | #46 | Exceptional 1.1% |
| Immigrants from Sweden | 99.8 /100 | #47 | Exceptional 1.1% |
| Immigrants from Singapore | 99.7 /100 | #48 | Exceptional 1.1% |
| Immigrants from Russia | 99.7 /100 | #49 | Exceptional 1.1% |
| Immigrants from Japan | 99.7 /100 | #50 | Exceptional 1.1% |
| Immigrants from Kazakhstan | 99.7 /100 | #51 | Exceptional 1.1% |
| Immigrants from Bolivia | 99.6 /100 | #52 | Exceptional 1.1% |
| Asians | 99.6 /100 | #53 | Exceptional 1.1% |
| Immigrants from El Salvador | 99.6 /100 | #54 | Exceptional 1.1% |
| Salvadorans | 99.5 /100 | #55 | Exceptional 1.1% |
Immigrants from Singapore Disability Age Under 5 Correlation Summary
| Measurement | Immigrants from Singapore Data | Disability Age Under 5 Data |
| Minimum | 0.011% | 0.71% |
| Maximum | 1.5% | 6.3% |
| Range | 1.5% | 5.6% |
| Mean | 0.44% | 2.2% |
| Median | 0.32% | 1.2% |
| Interquartile 25% (IQ1) | 0.16% | 1.00% |
| Interquartile 75% (IQ3) | 0.56% | 3.2% |
| Interquartile Range (IQR) | 0.40% | 2.2% |
| Standard Deviation (Sample) | 0.39% | 1.7% |
| Standard Deviation (Population) | 0.38% | 1.7% |
Correlation Details
| Immigrants from Singapore Percentile | Sample Size | Disability Age Under 5 |
[ 0.0% - 0.5% ] 0.011% | 54,375,149 | 0.81% |
[ 0.0% - 0.5% ] 0.034% | 22,960,559 | 0.81% |
[ 0.0% - 0.5% ] 0.056% | 7,915,824 | 1.2% |
[ 0.0% - 0.5% ] 0.081% | 5,387,950 | 1.1% |
[ 0.0% - 0.5% ] 0.10% | 1,577,773 | 0.98% |
[ 0.0% - 0.5% ] 0.13% | 1,559,109 | 1.0% |
[ 0.0% - 0.5% ] 0.15% | 1,275,144 | 1.0% |
[ 0.0% - 0.5% ] 0.17% | 391,430 | 0.92% |
[ 0.0% - 0.5% ] 0.20% | 536,070 | 1.1% |
[ 0.0% - 0.5% ] 0.22% | 405,934 | 1.4% |
[ 0.0% - 0.5% ] 0.24% | 286,357 | 0.80% |
[ 0.0% - 0.5% ] 0.26% | 189,405 | 1.1% |
[ 0.0% - 0.5% ] 0.29% | 207,501 | 1.2% |
[ 0.0% - 0.5% ] 0.31% | 194,035 | 1.6% |
[ 0.0% - 0.5% ] 0.32% | 39,904 | 3.7% |
[ 0.0% - 0.5% ] 0.36% | 5,590 | 5.5% |
[ 0.0% - 0.5% ] 0.37% | 13,618 | 2.8% |
[ 0.0% - 0.5% ] 0.43% | 4,222 | 4.5% |
[ 0.0% - 0.5% ] 0.48% | 41,619 | 1.8% |
[ 0.0% - 0.5% ] 0.50% | 9,014 | 6.3% |
[ 0.5% - 1.0% ] 0.53% | 24,444 | 0.94% |
[ 0.5% - 1.0% ] 0.60% | 51,978 | 1.8% |
[ 0.5% - 1.0% ] 0.86% | 26,927 | 0.71% |
[ 0.5% - 1.0% ] 0.90% | 22,106 | 5.6% |
[ 0.5% - 1.0% ] 0.95% | 30,450 | 1.0% |
[ 1.0% - 1.5% ] 1.07% | 10,534 | 3.5% |
[ 1.0% - 1.5% ] 1.25% | 16,026 | 4.7% |
[ 1.0% - 1.5% ] 1.48% | 6,368 | 2.9% |