Immigrants from Syria Disability Age Under 5

COMPARE

Immigrants from Syria
Race
Ancestry
AfghanAfricanAlaska NativeAlaskan AthabascanAlbanianAleutAlsatianAmericanApacheArabArapahoArgentineanArmenianAssyrian/Chaldean/SyriacAustralianAustrianBahamianBangladeshiBarbadianBasqueBelgianBelizeanBermudanBhutaneseBlackfeetBolivianBrazilianBritishBritish West IndianBulgarianBurmeseCajunCambodianCanadianCape VerdeanCarpatho RusynCelticCentral AmericanCentral American IndianCherokeeCheyenneChickasawChileanChineseChippewaChoctawColombianColvilleComancheCosta RicanCreeCreekCroatianCrowCubanCypriotCzechCzechoslovakianDanishDelawareDominicanDutchDutch West IndianEastern EuropeanEcuadorianEgyptianEnglishEstonianEthiopianEuropeanFijianFilipinoFinnishFrenchFrench American IndianFrench CanadianGermanGerman RussianGhanaianGreekGuamanian/ChamorroGuatemalanGuyaneseHaitianHmongHonduranHopiHoumaHungarianIcelanderIndian (Asian)IndonesianInupiatIranianIraqiIrishIroquoisIsraeliItalianJamaicanJapaneseJordanianKenyanKiowaKoreanLaotianLatvianLebaneseLiberianLithuanianLumbeeLuxembourgerMacedonianMalaysianMalteseMarshalleseMenomineeMexicanMexican American IndianMongolianMoroccanNative HawaiianNavajoNepaleseNew ZealanderNicaraguanNigerianNorthern EuropeanNorwegianOkinawanOsageOttawaPaiutePakistaniPalestinianPanamanianParaguayanPennsylvania GermanPeruvianPimaPolishPortuguesePotawatomiPuebloPuerto RicanPuget Sound SalishRomanianRussianSalvadoranSamoanScandinavianScotch-IrishScottishSeminoleSenegaleseSerbianShoshoneSierra LeoneanSiouxSlavicSlovakSloveneSomaliSouth AfricanSouth AmericanSouth American IndianSoviet UnionSpaniardSpanishSpanish AmericanSpanish American IndianSri LankanSubsaharan AfricanSudaneseSwedishSwissSyrianTaiwaneseThaiTlingit-HaidaTohono O'OdhamTonganTrinidadian and TobagonianTsimshianTurkishU.S. Virgin IslanderUgandanUkrainianUruguayanUteVenezuelanVietnameseWelshWest IndianYakamaYaquiYugoslavianYumanYup'ikZimbabwean
Immigration
NonimmigrantsImmigrantsAfghanistanAfricaAlbaniaArgentinaArmeniaAsiaAustraliaAustriaBahamasBangladeshBarbadosBelarusBelgiumBelizeBoliviaBosnia and HerzegovinaBrazilBulgariaBurma/MyanmarCabo VerdeCambodiaCameroonCanadaCaribbeanCentral AmericaChileChinaColombiaCongoCosta RicaCroatiaCubaCzechoslovakiaDenmarkDominicaDominican RepublicEastern AfricaEastern AsiaEastern EuropeEcuadorEgyptEl SalvadorEnglandEritreaEthiopiaEuropeFijiFranceGermanyGhanaGreeceGrenadaGuatemalaGuyanaHaitiHondurasHong KongHungaryIndiaIndonesiaIranIraqIrelandIsraelItalyJamaicaJapanJordanKazakhstanKenyaKoreaKuwaitLaosLatin AmericaLatviaLebanonLiberiaLithuaniaMalaysiaMexicoMicronesiaMiddle AfricaMoldovaMoroccoNepalNetherlandsNicaraguaNigeriaNorth AmericaNorth MacedoniaNorthern AfricaNorthern EuropeNorwayOceaniaPakistanPanamaPeruPhilippinesPolandPortugalRomaniaRussiaSaudi ArabiaScotlandSenegalSerbiaSierra LeoneSingaporeSomaliaSouth AfricaSouth AmericaSouth Central AsiaSouth Eastern AsiaSouthern EuropeSpainSri LankaSt. Vincent and the GrenadinesSudanSwedenSwitzerlandSyriaTaiwanThailandTrinidad and TobagoTurkeyUgandaUkraineUruguayUzbekistanVenezuelaVietnamWest IndiesWestern AfricaWestern AsiaWestern EuropeYemenZaireZimbabweAzores
Select to Compare
Race
Ancestry
AfghanAfricanAlaska NativeAlaskan AthabascanAlbanianAleutAlsatianAmericanApacheArabArapahoArgentineanArmenianAssyrian/Chaldean/SyriacAustralianAustrianBahamianBangladeshiBarbadianBasqueBelgianBelizeanBermudanBhutaneseBlackfeetBolivianBrazilianBritishBritish West IndianBulgarianBurmeseCajunCambodianCanadianCape VerdeanCarpatho RusynCelticCentral AmericanCentral American IndianCherokeeCheyenneChickasawChileanChineseChippewaChoctawColombianColvilleComancheCosta RicanCreeCreekCroatianCrowCubanCypriotCzechCzechoslovakianDanishDelawareDominicanDutchDutch West IndianEastern EuropeanEcuadorianEgyptianEnglishEstonianEthiopianEuropeanFijianFilipinoFinnishFrenchFrench American IndianFrench CanadianGermanGerman RussianGhanaianGreekGuamanian/ChamorroGuatemalanGuyaneseHaitianHmongHonduranHopiHoumaHungarianIcelanderIndian (Asian)IndonesianInupiatIranianIraqiIrishIroquoisIsraeliItalianJamaicanJapaneseJordanianKenyanKiowaKoreanLaotianLatvianLebaneseLiberianLithuanianLumbeeLuxembourgerMacedonianMalaysianMalteseMarshalleseMenomineeMexicanMexican American IndianMongolianMoroccanNative HawaiianNavajoNepaleseNew ZealanderNicaraguanNigerianNorthern EuropeanNorwegianOkinawanOsageOttawaPaiutePakistaniPalestinianPanamanianParaguayanPennsylvania GermanPeruvianPimaPolishPortuguesePotawatomiPuebloPuerto RicanPuget Sound SalishRomanianRussianSalvadoranSamoanScandinavianScotch-IrishScottishSeminoleSenegaleseSerbianShoshoneSierra LeoneanSiouxSlavicSlovakSloveneSomaliSouth AfricanSouth AmericanSouth American IndianSoviet UnionSpaniardSpanishSpanish AmericanSpanish American IndianSri LankanSubsaharan AfricanSudaneseSwedishSwissSyrianTaiwaneseThaiTlingit-HaidaTohono O'OdhamTonganTrinidadian and TobagonianTsimshianTurkishU.S. Virgin IslanderUgandanUkrainianUruguayanUteVenezuelanVietnameseWelshWest IndianYakamaYaquiYugoslavianYumanYup'ikZimbabwean
Immigration
NonimmigrantsImmigrantsAfghanistanAfricaAlbaniaArgentinaArmeniaAsiaAustraliaAustriaBahamasBangladeshBarbadosBelarusBelgiumBelizeBoliviaBosnia and HerzegovinaBrazilBulgariaBurma/MyanmarCabo VerdeCambodiaCameroonCanadaCaribbeanCentral AmericaChileChinaColombiaCongoCosta RicaCroatiaCubaCzechoslovakiaDenmarkDominicaDominican RepublicEastern AfricaEastern AsiaEastern EuropeEcuadorEgyptEl SalvadorEnglandEritreaEthiopiaEuropeFijiFranceGermanyGhanaGreeceGrenadaGuatemalaGuyanaHaitiHondurasHong KongHungaryIndiaIndonesiaIranIraqIrelandIsraelItalyJamaicaJapanJordanKazakhstanKenyaKoreaKuwaitLaosLatin AmericaLatviaLebanonLiberiaLithuaniaMalaysiaMexicoMicronesiaMiddle AfricaMoldovaMoroccoNepalNetherlandsNicaraguaNigeriaNorth AmericaNorth MacedoniaNorthern AfricaNorthern EuropeNorwayOceaniaPakistanPanamaPeruPhilippinesPolandPortugalRomaniaRussiaSaudi ArabiaScotlandSenegalSerbiaSierra LeoneSingaporeSomaliaSouth AfricaSouth AmericaSouth Central AsiaSouth Eastern AsiaSouthern EuropeSpainSri LankaSt. Vincent and the GrenadinesSudanSwedenSwitzerlandTaiwanThailandTrinidad and TobagoTurkeyUgandaUkraineUruguayUzbekistanVenezuelaVietnamWest IndiesWestern AfricaWestern AsiaWestern EuropeYemenZaireZimbabweAzores
Disability Age Under 5
Income
Poverty
Unemployment
Labor Participation
Family Structure
Vehicle Availability
Education Level
Disability

Immigrants from Syria Disability Age Under 5
Exceptional

1.1%
DISABILITY | AGE UNDER 5
97.9/ 100
METRIC RATING
83rd/ 347
METRIC RANK

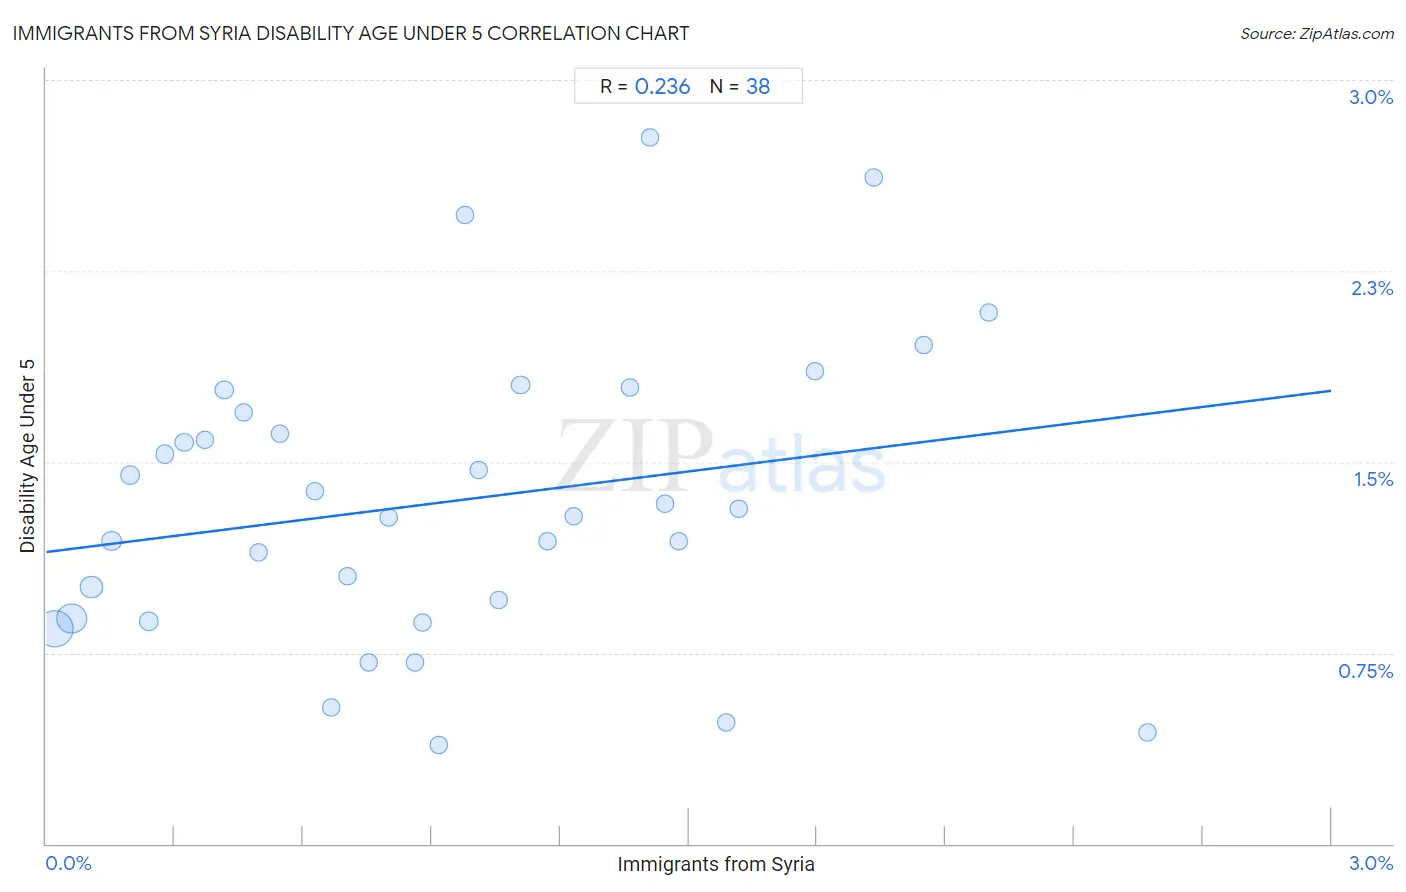
Immigrants from Syria Disability Age Under 5 Correlation Chart

The statistical analysis conducted on geographies consisting of 121,605,651 people shows a weak positive correlation between the proportion of Immigrants from Syria and percentage of population with a disability under the age of 5 in the United States with a correlation coefficient (R) of 0.236 and weighted average of 1.1%. On average, for every 1% (one percent) increase in Immigrants from Syria within a typical geography, there is an increase of 0.21% in percentage of population with a disability under the age of 5.
Immigrants from Syria Disability Age Under 5
It is essential to understand that the correlation between the percentage of Immigrants from Syria and percentage of population with a disability under the age of 5 does not imply a direct cause-and-effect relationship. It remains uncertain whether the presence of Immigrants from Syria influences an upward or downward trend in the level of percentage of population with a disability under the age of 5 within an area, or if Immigrants from Syria simply ended up residing in those areas with higher or lower levels of percentage of population with a disability under the age of 5 due to other factors.

Demographics Similar to Immigrants from Syria by Disability Age Under 5

In terms of disability age under 5, the demographic groups most similar to Immigrants from Syria are Immigrants from Jordan (1.1%, a difference of 0.010%), Turkish (1.1%, a difference of 0.12%), Immigrants from Trinidad and Tobago (1.1%, a difference of 0.14%), Immigrants from Zaire (1.1%, a difference of 0.15%), and Hmong (1.1%, a difference of 0.16%).
DemographicsRating | RankDisability Age Under 5
Immigrants from Burma/Myanmar
98.2
/100
|
#76
Exceptional
1.1%
Immigrants from Denmark
98.1
/100
|
#77
Exceptional
1.1%
West Indians
98.0
/100
|
#78
Exceptional
1.1%
Hmong
98.0
/100
|
#79
Exceptional
1.1%
Immigrants from Trinidad and Tobago
98.0
/100
|
#80
Exceptional
1.1%
Turks
98.0
/100
|
#81
Exceptional
1.1%
Immigrants from Jordan
97.9
/100
|
#82
Exceptional
1.1%
Immigrants from Syria
97.9
/100
|
#83
Exceptional
1.1%
Immigrants from Zaire
97.8
/100
|
#84
Exceptional
1.1%
Sudanese
97.7
/100
|
#85
Exceptional
1.1%
Okinawans
97.6
/100
|
#86
Exceptional
1.1%
Ugandans
97.5
/100
|
#87
Exceptional
1.1%
Immigrants from Dominican Republic
97.5
/100
|
#88
Exceptional
1.1%
Ethiopians
97.2
/100
|
#89
Exceptional
1.1%
Chinese
97.2
/100
|
#90
Exceptional
1.1%

Immigrants from Syria Disability Age Under 5 Correlation Summary

MeasurementImmigrants from Syria DataDisability Age Under 5 Data
Minimum0.020%0.39%
Maximum2.6%2.8%
Range2.6%2.4%
Mean0.94%1.3%
Median0.87%1.3%
Interquartile 25% (IQ1)0.42%0.88%
Interquartile 75% (IQ3)1.4%1.7%
Interquartile Range (IQR)0.99%0.81%
Standard Deviation (Sample)0.65%0.58%
Standard Deviation (Population)0.64%0.57%

Correlation Details

Immigrants from Syria PercentileSample SizeDisability Age Under 5
[
0.0%
-
0.5%
]
0.020%
55,357,6290.84%
[
0.0%
-
0.5%
]
0.060%
34,237,1810.88%
[
0.0%
-
0.5%
]
0.11%
13,458,9571.0%
[
0.0%
-
0.5%
]
0.15%
5,424,5521.2%
[
0.0%
-
0.5%
]
0.20%
2,926,0141.4%
[
0.0%
-
0.5%
]
0.24%
3,328,9760.87%
[
0.0%
-
0.5%
]
0.28%
1,290,0571.5%
[
0.0%
-
0.5%
]
0.32%
1,028,4631.6%
[
0.0%
-
0.5%
]
0.37%
704,2621.6%
[
0.0%
-
0.5%
]
0.42%
422,8711.8%
[
0.0%
-
0.5%
]
0.46%
415,9301.7%
[
0.0%
-
0.5%
]
0.50%
534,8711.1%
[
0.5%
-
1.0%
]
0.55%
261,5271.6%
[
0.5%
-
1.0%
]
0.63%
294,5961.4%
[
0.5%
-
1.0%
]
0.67%
42,3100.53%
[
0.5%
-
1.0%
]
0.70%
181,4321.1%
[
0.5%
-
1.0%
]
0.75%
253,7650.71%
[
0.5%
-
1.0%
]
0.80%
306,4571.3%
[
0.5%
-
1.0%
]
0.86%
101,2810.71%
[
0.5%
-
1.0%
]
0.88%
106,1370.87%
[
0.5%
-
1.0%
]
0.92%
37,6350.39%
[
0.5%
-
1.0%
]
0.98%
68,4182.5%
[
1.0%
-
1.5%
]
1.01%
42,6211.5%
[
1.0%
-
1.5%
]
1.06%
25,8600.96%
[
1.0%
-
1.5%
]
1.11%
77,5651.8%
[
1.0%
-
1.5%
]
1.17%
59,7751.2%
[
1.0%
-
1.5%
]
1.23%
241,8411.3%
[
1.0%
-
1.5%
]
1.36%
76,8781.8%
[
1.0%
-
1.5%
]
1.41%
41,6172.8%
[
1.0%
-
1.5%
]
1.44%
35,9181.3%
[
1.0%
-
1.5%
]
1.48%
13,5401.2%
[
1.5%
-
2.0%
]
1.59%
20,0870.47%
[
1.5%
-
2.0%
]
1.62%
35,0531.3%
[
1.5%
-
2.0%
]
1.80%
17,2121.9%
[
1.5%
-
2.0%
]
1.93%
31,6712.6%
[
2.0%
-
2.5%
]
2.05%
9,7612.0%
[
2.0%
-
2.5%
]
2.20%
12,8182.1%
[
2.5%
-
3.0%
]
2.57%
80,1130.44%