Assyrian/Chaldean/Syriac Disability Age Under 5

COMPARE

Assyrian/Chaldean/Syriac
Race
Ancestry
AfghanAfricanAlaska NativeAlaskan AthabascanAlbanianAleutAlsatianAmericanApacheArabArapahoArgentineanArmenianAssyrian/Chaldean/SyriacAustralianAustrianBahamianBangladeshiBarbadianBasqueBelgianBelizeanBermudanBhutaneseBlackfeetBolivianBrazilianBritishBritish West IndianBulgarianBurmeseCajunCambodianCanadianCape VerdeanCarpatho RusynCelticCentral AmericanCentral American IndianCherokeeCheyenneChickasawChileanChineseChippewaChoctawColombianColvilleComancheCosta RicanCreeCreekCroatianCrowCubanCypriotCzechCzechoslovakianDanishDelawareDominicanDutchDutch West IndianEastern EuropeanEcuadorianEgyptianEnglishEstonianEthiopianEuropeanFijianFilipinoFinnishFrenchFrench American IndianFrench CanadianGermanGerman RussianGhanaianGreekGuamanian/ChamorroGuatemalanGuyaneseHaitianHmongHonduranHopiHoumaHungarianIcelanderIndian (Asian)IndonesianInupiatIranianIraqiIrishIroquoisIsraeliItalianJamaicanJapaneseJordanianKenyanKiowaKoreanLaotianLatvianLebaneseLiberianLithuanianLumbeeLuxembourgerMacedonianMalaysianMalteseMarshalleseMenomineeMexicanMexican American IndianMongolianMoroccanNative HawaiianNavajoNepaleseNew ZealanderNicaraguanNigerianNorthern EuropeanNorwegianOkinawanOsageOttawaPaiutePakistaniPalestinianPanamanianParaguayanPennsylvania GermanPeruvianPimaPolishPortuguesePotawatomiPuebloPuerto RicanPuget Sound SalishRomanianRussianSalvadoranSamoanScandinavianScotch-IrishScottishSeminoleSenegaleseSerbianShoshoneSierra LeoneanSiouxSlavicSlovakSloveneSomaliSouth AfricanSouth AmericanSouth American IndianSoviet UnionSpaniardSpanishSpanish AmericanSpanish American IndianSri LankanSubsaharan AfricanSudaneseSwedishSwissSyrianTaiwaneseThaiTlingit-HaidaTohono O'OdhamTonganTrinidadian and TobagonianTsimshianTurkishU.S. Virgin IslanderUgandanUkrainianUruguayanUteVenezuelanVietnameseWelshWest IndianYakamaYaquiYugoslavianYumanYup'ikZimbabwean
Immigration
NonimmigrantsImmigrantsAfghanistanAfricaAlbaniaArgentinaArmeniaAsiaAustraliaAustriaBahamasBangladeshBarbadosBelarusBelgiumBelizeBoliviaBosnia and HerzegovinaBrazilBulgariaBurma/MyanmarCabo VerdeCambodiaCameroonCanadaCaribbeanCentral AmericaChileChinaColombiaCongoCosta RicaCroatiaCubaCzechoslovakiaDenmarkDominicaDominican RepublicEastern AfricaEastern AsiaEastern EuropeEcuadorEgyptEl SalvadorEnglandEritreaEthiopiaEuropeFijiFranceGermanyGhanaGreeceGrenadaGuatemalaGuyanaHaitiHondurasHong KongHungaryIndiaIndonesiaIranIraqIrelandIsraelItalyJamaicaJapanJordanKazakhstanKenyaKoreaKuwaitLaosLatin AmericaLatviaLebanonLiberiaLithuaniaMalaysiaMexicoMicronesiaMiddle AfricaMoldovaMoroccoNepalNetherlandsNicaraguaNigeriaNorth AmericaNorth MacedoniaNorthern AfricaNorthern EuropeNorwayOceaniaPakistanPanamaPeruPhilippinesPolandPortugalRomaniaRussiaSaudi ArabiaScotlandSenegalSerbiaSierra LeoneSingaporeSomaliaSouth AfricaSouth AmericaSouth Central AsiaSouth Eastern AsiaSouthern EuropeSpainSri LankaSt. Vincent and the GrenadinesSudanSwedenSwitzerlandSyriaTaiwanThailandTrinidad and TobagoTurkeyUgandaUkraineUruguayUzbekistanVenezuelaVietnamWest IndiesWestern AfricaWestern AsiaWestern EuropeYemenZaireZimbabweAzores
Select to Compare
Race
Ancestry
AfghanAfricanAlaska NativeAlaskan AthabascanAlbanianAleutAlsatianAmericanApacheArabArapahoArgentineanArmenianAustralianAustrianBahamianBangladeshiBarbadianBasqueBelgianBelizeanBermudanBhutaneseBlackfeetBolivianBrazilianBritishBritish West IndianBulgarianBurmeseCajunCambodianCanadianCape VerdeanCarpatho RusynCelticCentral AmericanCentral American IndianCherokeeCheyenneChickasawChileanChineseChippewaChoctawColombianColvilleComancheCosta RicanCreeCreekCroatianCrowCubanCypriotCzechCzechoslovakianDanishDelawareDominicanDutchDutch West IndianEastern EuropeanEcuadorianEgyptianEnglishEstonianEthiopianEuropeanFijianFilipinoFinnishFrenchFrench American IndianFrench CanadianGermanGerman RussianGhanaianGreekGuamanian/ChamorroGuatemalanGuyaneseHaitianHmongHonduranHopiHoumaHungarianIcelanderIndian (Asian)IndonesianInupiatIranianIraqiIrishIroquoisIsraeliItalianJamaicanJapaneseJordanianKenyanKiowaKoreanLaotianLatvianLebaneseLiberianLithuanianLumbeeLuxembourgerMacedonianMalaysianMalteseMarshalleseMenomineeMexicanMexican American IndianMongolianMoroccanNative HawaiianNavajoNepaleseNew ZealanderNicaraguanNigerianNorthern EuropeanNorwegianOkinawanOsageOttawaPaiutePakistaniPalestinianPanamanianParaguayanPennsylvania GermanPeruvianPimaPolishPortuguesePotawatomiPuebloPuerto RicanPuget Sound SalishRomanianRussianSalvadoranSamoanScandinavianScotch-IrishScottishSeminoleSenegaleseSerbianShoshoneSierra LeoneanSiouxSlavicSlovakSloveneSomaliSouth AfricanSouth AmericanSouth American IndianSoviet UnionSpaniardSpanishSpanish AmericanSpanish American IndianSri LankanSubsaharan AfricanSudaneseSwedishSwissSyrianTaiwaneseThaiTlingit-HaidaTohono O'OdhamTonganTrinidadian and TobagonianTsimshianTurkishU.S. Virgin IslanderUgandanUkrainianUruguayanUteVenezuelanVietnameseWelshWest IndianYakamaYaquiYugoslavianYumanYup'ikZimbabwean
Immigration
NonimmigrantsImmigrantsAfghanistanAfricaAlbaniaArgentinaArmeniaAsiaAustraliaAustriaBahamasBangladeshBarbadosBelarusBelgiumBelizeBoliviaBosnia and HerzegovinaBrazilBulgariaBurma/MyanmarCabo VerdeCambodiaCameroonCanadaCaribbeanCentral AmericaChileChinaColombiaCongoCosta RicaCroatiaCubaCzechoslovakiaDenmarkDominicaDominican RepublicEastern AfricaEastern AsiaEastern EuropeEcuadorEgyptEl SalvadorEnglandEritreaEthiopiaEuropeFijiFranceGermanyGhanaGreeceGrenadaGuatemalaGuyanaHaitiHondurasHong KongHungaryIndiaIndonesiaIranIraqIrelandIsraelItalyJamaicaJapanJordanKazakhstanKenyaKoreaKuwaitLaosLatin AmericaLatviaLebanonLiberiaLithuaniaMalaysiaMexicoMicronesiaMiddle AfricaMoldovaMoroccoNepalNetherlandsNicaraguaNigeriaNorth AmericaNorth MacedoniaNorthern AfricaNorthern EuropeNorwayOceaniaPakistanPanamaPeruPhilippinesPolandPortugalRomaniaRussiaSaudi ArabiaScotlandSenegalSerbiaSierra LeoneSingaporeSomaliaSouth AfricaSouth AmericaSouth Central AsiaSouth Eastern AsiaSouthern EuropeSpainSri LankaSt. Vincent and the GrenadinesSudanSwedenSwitzerlandSyriaTaiwanThailandTrinidad and TobagoTurkeyUgandaUkraineUruguayUzbekistanVenezuelaVietnamWest IndiesWestern AfricaWestern AsiaWestern EuropeYemenZaireZimbabweAzores
Disability Age Under 5
Income
Poverty
Unemployment
Labor Participation
Family Structure
Vehicle Availability
Education Level
Disability

Assyrian/Chaldean/Syriac Disability Age Under 5
Exceptional

1.1%
DISABILITY | AGE UNDER 5
99.5/ 100
METRIC RATING
57th/ 347
METRIC RANK

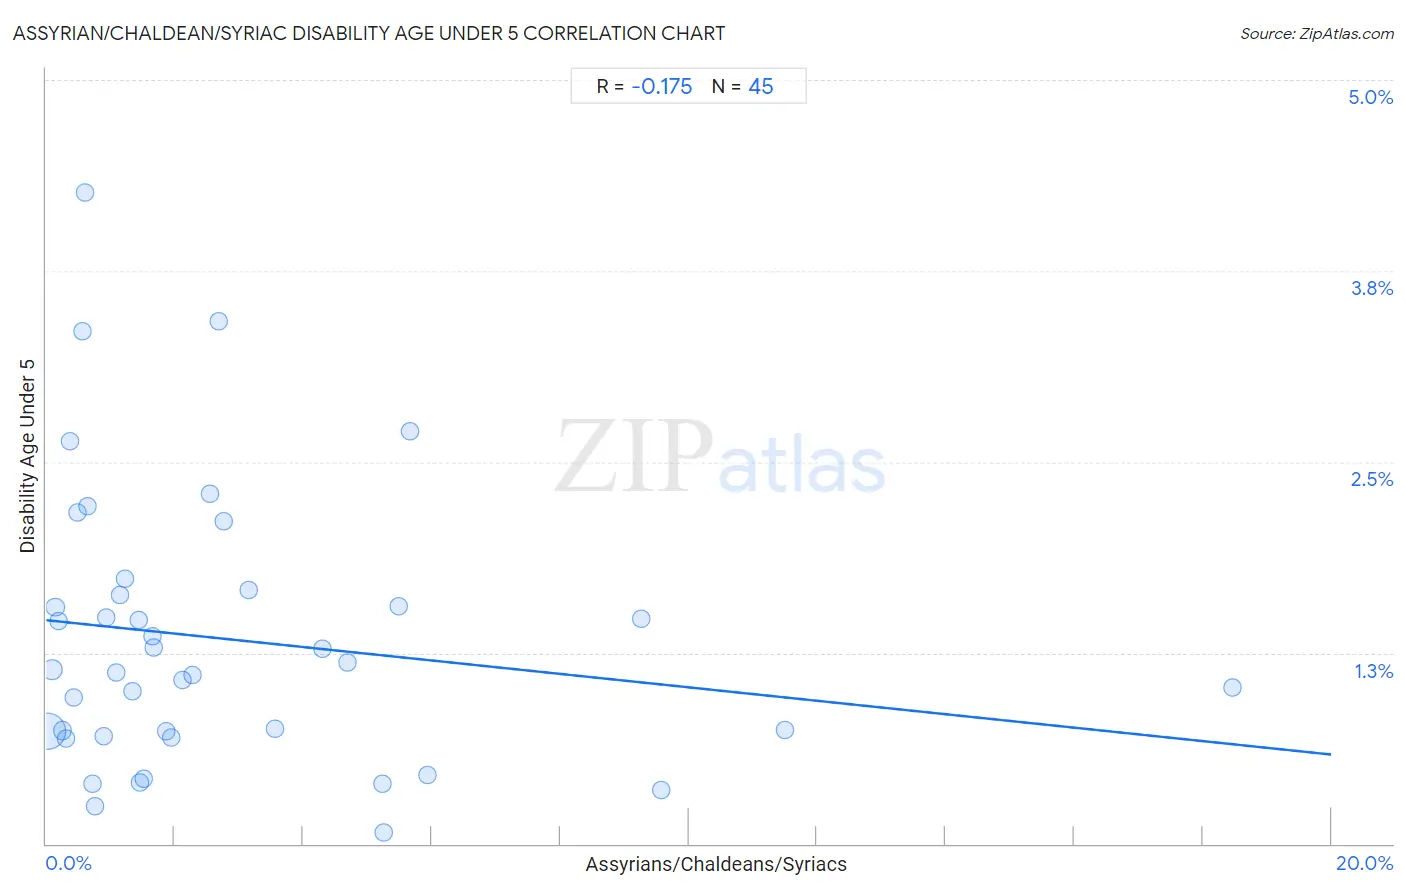
Assyrian/Chaldean/Syriac Disability Age Under 5 Correlation Chart

The statistical analysis conducted on geographies consisting of 81,585,974 people shows a poor negative correlation between the proportion of Assyrians/Chaldeans/Syriacs and percentage of population with a disability under the age of 5 in the United States with a correlation coefficient (R) of -0.175 and weighted average of 1.1%. On average, for every 1% (one percent) increase in Assyrians/Chaldeans/Syriacs within a typical geography, there is a decrease of 0.044% in percentage of population with a disability under the age of 5.
Assyrian/Chaldean/Syriac Disability Age Under 5
It is essential to understand that the correlation between the percentage of Assyrians/Chaldeans/Syriacs and percentage of population with a disability under the age of 5 does not imply a direct cause-and-effect relationship. It remains uncertain whether the presence of Assyrians/Chaldeans/Syriacs influences an upward or downward trend in the level of percentage of population with a disability under the age of 5 within an area, or if Assyrians/Chaldeans/Syriacs simply ended up residing in those areas with higher or lower levels of percentage of population with a disability under the age of 5 due to other factors.

Demographics Similar to Assyrians/Chaldeans/Syriacs by Disability Age Under 5

In terms of disability age under 5, the demographic groups most similar to Assyrians/Chaldeans/Syriacs are Ecuadorian (1.1%, a difference of 0.030%), Immigrants from Egypt (1.1%, a difference of 0.19%), Immigrants from Malaysia (1.1%, a difference of 0.30%), Salvadoran (1.1%, a difference of 0.42%), and Immigrants from El Salvador (1.1%, a difference of 0.52%).
DemographicsRating | RankDisability Age Under 5
Immigrants from Japan
99.7
/100
|
#50
Exceptional
1.1%
Immigrants from Kazakhstan
99.7
/100
|
#51
Exceptional
1.1%
Immigrants from Bolivia
99.6
/100
|
#52
Exceptional
1.1%
Asians
99.6
/100
|
#53
Exceptional
1.1%
Immigrants from El Salvador
99.6
/100
|
#54
Exceptional
1.1%
Salvadorans
99.5
/100
|
#55
Exceptional
1.1%
Ecuadorians
99.5
/100
|
#56
Exceptional
1.1%
Assyrians/Chaldeans/Syriacs
99.5
/100
|
#57
Exceptional
1.1%
Immigrants from Egypt
99.4
/100
|
#58
Exceptional
1.1%
Immigrants from Malaysia
99.4
/100
|
#59
Exceptional
1.1%
Immigrants from Western Asia
99.2
/100
|
#60
Exceptional
1.1%
Immigrants from Ethiopia
99.2
/100
|
#61
Exceptional
1.1%
Immigrants from Switzerland
99.2
/100
|
#62
Exceptional
1.1%
Immigrants from Vietnam
99.1
/100
|
#63
Exceptional
1.1%
Egyptians
98.9
/100
|
#64
Exceptional
1.1%

Assyrian/Chaldean/Syriac Disability Age Under 5 Correlation Summary

MeasurementAssyrian/Chaldean/Syriac DataDisability Age Under 5 Data
Minimum0.015%0.070%
Maximum18.5%4.3%
Range18.5%4.2%
Mean2.8%1.3%
Median1.5%1.1%
Interquartile 25% (IQ1)0.62%0.72%
Interquartile 75% (IQ3)3.9%1.6%
Interquartile Range (IQR)3.3%0.92%
Standard Deviation (Sample)3.6%0.90%
Standard Deviation (Population)3.5%0.89%

Correlation Details

Assyrian/Chaldean/Syriac PercentileSample SizeDisability Age Under 5
[
0.0%
-
0.5%
]
0.015%
62,818,5120.74%
[
0.0%
-
0.5%
]
0.091%
10,428,4441.1%
[
0.0%
-
0.5%
]
0.14%
2,123,4521.5%
[
0.0%
-
0.5%
]
0.19%
1,143,7781.5%
[
0.0%
-
0.5%
]
0.26%
493,8460.74%
[
0.0%
-
0.5%
]
0.31%
1,816,7610.69%
[
0.0%
-
0.5%
]
0.37%
161,3322.6%
[
0.0%
-
0.5%
]
0.43%
177,1160.96%
[
0.0%
-
0.5%
]
0.48%
78,8002.2%
[
0.5%
-
1.0%
]
0.56%
67,3783.4%
[
0.5%
-
1.0%
]
0.61%
105,0204.3%
[
0.5%
-
1.0%
]
0.64%
10,0672.2%
[
0.5%
-
1.0%
]
0.71%
30,4180.39%
[
0.5%
-
1.0%
]
0.76%
44,2550.25%
[
0.5%
-
1.0%
]
0.89%
335,1980.71%
[
0.5%
-
1.0%
]
0.93%
137,8821.5%
[
1.0%
-
1.5%
]
1.09%
61,9881.1%
[
1.0%
-
1.5%
]
1.15%
30,1301.6%
[
1.0%
-
1.5%
]
1.23%
84,1671.7%
[
1.0%
-
1.5%
]
1.34%
76,0411.00%
[
1.0%
-
1.5%
]
1.43%
42,6211.5%
[
1.0%
-
1.5%
]
1.45%
65,8700.40%
[
1.5%
-
2.0%
]
1.51%
88,2300.43%
[
1.5%
-
2.0%
]
1.65%
24,2541.4%
[
1.5%
-
2.0%
]
1.67%
69,6381.3%
[
1.5%
-
2.0%
]
1.87%
162,3150.74%
[
1.5%
-
2.0%
]
1.94%
30,6260.70%
[
2.0%
-
2.5%
]
2.12%
10,4611.1%
[
2.0%
-
2.5%
]
2.28%
33,0331.1%
[
2.5%
-
3.0%
]
2.55%
61,4942.3%
[
2.5%
-
3.0%
]
2.68%
78,0683.4%
[
2.5%
-
3.0%
]
2.76%
38,0032.1%
[
3.0%
-
3.5%
]
3.16%
19,0831.7%
[
3.5%
-
4.0%
]
3.55%
23,7650.76%
[
4.0%
-
4.5%
]
4.30%
105,7211.3%
[
4.5%
-
5.0%
]
4.69%
59,7751.2%
[
5.0%
-
5.5%
]
5.23%
45,9370.40%
[
5.0%
-
5.5%
]
5.25%
27,8480.070%
[
5.0%
-
5.5%
]
5.48%
67,0761.6%
[
5.5%
-
6.0%
]
5.66%
29,3302.7%
[
5.5%
-
6.0%
]
5.94%
33,1700.45%
[
9.0%
-
9.5%
]
9.27%
34,9211.5%
[
9.5%
-
10.0%
]
9.58%
33,1740.35%
[
11.0%
-
11.5%
]
11.50%
133,7440.75%
[
18.0%
-
18.5%
]
18.47%
43,2321.0%