French Canadian Disability Age Under 5

COMPARE

French Canadian
Race
Ancestry
AfghanAfricanAlaska NativeAlaskan AthabascanAlbanianAleutAlsatianAmericanApacheArabArapahoArgentineanArmenianAssyrian/Chaldean/SyriacAustralianAustrianBahamianBangladeshiBarbadianBasqueBelgianBelizeanBermudanBhutaneseBlackfeetBolivianBrazilianBritishBritish West IndianBulgarianBurmeseCajunCambodianCanadianCape VerdeanCarpatho RusynCelticCentral AmericanCentral American IndianCherokeeCheyenneChickasawChileanChineseChippewaChoctawColombianColvilleComancheCosta RicanCreeCreekCroatianCrowCubanCypriotCzechCzechoslovakianDanishDelawareDominicanDutchDutch West IndianEastern EuropeanEcuadorianEgyptianEnglishEstonianEthiopianEuropeanFijianFilipinoFinnishFrenchFrench American IndianFrench CanadianGermanGerman RussianGhanaianGreekGuamanian/ChamorroGuatemalanGuyaneseHaitianHmongHonduranHopiHoumaHungarianIcelanderIndian (Asian)IndonesianInupiatIranianIraqiIrishIroquoisIsraeliItalianJamaicanJapaneseJordanianKenyanKiowaKoreanLaotianLatvianLebaneseLiberianLithuanianLumbeeLuxembourgerMacedonianMalaysianMalteseMarshalleseMenomineeMexicanMexican American IndianMongolianMoroccanNative HawaiianNavajoNepaleseNew ZealanderNicaraguanNigerianNorthern EuropeanNorwegianOkinawanOsageOttawaPaiutePakistaniPalestinianPanamanianParaguayanPennsylvania GermanPeruvianPimaPolishPortuguesePotawatomiPuebloPuerto RicanPuget Sound SalishRomanianRussianSalvadoranSamoanScandinavianScotch-IrishScottishSeminoleSenegaleseSerbianShoshoneSierra LeoneanSiouxSlavicSlovakSloveneSomaliSouth AfricanSouth AmericanSouth American IndianSoviet UnionSpaniardSpanishSpanish AmericanSpanish American IndianSri LankanSubsaharan AfricanSudaneseSwedishSwissSyrianTaiwaneseThaiTlingit-HaidaTohono O'OdhamTonganTrinidadian and TobagonianTsimshianTurkishU.S. Virgin IslanderUgandanUkrainianUruguayanUteVenezuelanVietnameseWelshWest IndianYakamaYaquiYugoslavianYumanYup'ikZimbabwean
Immigration
NonimmigrantsImmigrantsAfghanistanAfricaAlbaniaArgentinaArmeniaAsiaAustraliaAustriaBahamasBangladeshBarbadosBelarusBelgiumBelizeBoliviaBosnia and HerzegovinaBrazilBulgariaBurma/MyanmarCabo VerdeCambodiaCameroonCanadaCaribbeanCentral AmericaChileChinaColombiaCongoCosta RicaCroatiaCubaCzechoslovakiaDenmarkDominicaDominican RepublicEastern AfricaEastern AsiaEastern EuropeEcuadorEgyptEl SalvadorEnglandEritreaEthiopiaEuropeFijiFranceGermanyGhanaGreeceGrenadaGuatemalaGuyanaHaitiHondurasHong KongHungaryIndiaIndonesiaIranIraqIrelandIsraelItalyJamaicaJapanJordanKazakhstanKenyaKoreaKuwaitLaosLatin AmericaLatviaLebanonLiberiaLithuaniaMalaysiaMexicoMicronesiaMiddle AfricaMoldovaMoroccoNepalNetherlandsNicaraguaNigeriaNorth AmericaNorth MacedoniaNorthern AfricaNorthern EuropeNorwayOceaniaPakistanPanamaPeruPhilippinesPolandPortugalRomaniaRussiaSaudi ArabiaScotlandSenegalSerbiaSierra LeoneSingaporeSomaliaSouth AfricaSouth AmericaSouth Central AsiaSouth Eastern AsiaSouthern EuropeSpainSri LankaSt. Vincent and the GrenadinesSudanSwedenSwitzerlandSyriaTaiwanThailandTrinidad and TobagoTurkeyUgandaUkraineUruguayUzbekistanVenezuelaVietnamWest IndiesWestern AfricaWestern AsiaWestern EuropeYemenZaireZimbabweAzores
Select to Compare
Race
Ancestry
AfghanAfricanAlaska NativeAlaskan AthabascanAlbanianAleutAlsatianAmericanApacheArabArapahoArgentineanArmenianAssyrian/Chaldean/SyriacAustralianAustrianBahamianBangladeshiBarbadianBasqueBelgianBelizeanBermudanBhutaneseBlackfeetBolivianBrazilianBritishBritish West IndianBulgarianBurmeseCajunCambodianCanadianCape VerdeanCarpatho RusynCelticCentral AmericanCentral American IndianCherokeeCheyenneChickasawChileanChineseChippewaChoctawColombianColvilleComancheCosta RicanCreeCreekCroatianCrowCubanCypriotCzechCzechoslovakianDanishDelawareDominicanDutchDutch West IndianEastern EuropeanEcuadorianEgyptianEnglishEstonianEthiopianEuropeanFijianFilipinoFinnishFrenchFrench American IndianGermanGerman RussianGhanaianGreekGuamanian/ChamorroGuatemalanGuyaneseHaitianHmongHonduranHopiHoumaHungarianIcelanderIndian (Asian)IndonesianInupiatIranianIraqiIrishIroquoisIsraeliItalianJamaicanJapaneseJordanianKenyanKiowaKoreanLaotianLatvianLebaneseLiberianLithuanianLumbeeLuxembourgerMacedonianMalaysianMalteseMarshalleseMenomineeMexicanMexican American IndianMongolianMoroccanNative HawaiianNavajoNepaleseNew ZealanderNicaraguanNigerianNorthern EuropeanNorwegianOkinawanOsageOttawaPaiutePakistaniPalestinianPanamanianParaguayanPennsylvania GermanPeruvianPimaPolishPortuguesePotawatomiPuebloPuerto RicanPuget Sound SalishRomanianRussianSalvadoranSamoanScandinavianScotch-IrishScottishSeminoleSenegaleseSerbianShoshoneSierra LeoneanSiouxSlavicSlovakSloveneSomaliSouth AfricanSouth AmericanSouth American IndianSoviet UnionSpaniardSpanishSpanish AmericanSpanish American IndianSri LankanSubsaharan AfricanSudaneseSwedishSwissSyrianTaiwaneseThaiTlingit-HaidaTohono O'OdhamTonganTrinidadian and TobagonianTsimshianTurkishU.S. Virgin IslanderUgandanUkrainianUruguayanUteVenezuelanVietnameseWelshWest IndianYakamaYaquiYugoslavianYumanYup'ikZimbabwean
Immigration
NonimmigrantsImmigrantsAfghanistanAfricaAlbaniaArgentinaArmeniaAsiaAustraliaAustriaBahamasBangladeshBarbadosBelarusBelgiumBelizeBoliviaBosnia and HerzegovinaBrazilBulgariaBurma/MyanmarCabo VerdeCambodiaCameroonCanadaCaribbeanCentral AmericaChileChinaColombiaCongoCosta RicaCroatiaCubaCzechoslovakiaDenmarkDominicaDominican RepublicEastern AfricaEastern AsiaEastern EuropeEcuadorEgyptEl SalvadorEnglandEritreaEthiopiaEuropeFijiFranceGermanyGhanaGreeceGrenadaGuatemalaGuyanaHaitiHondurasHong KongHungaryIndiaIndonesiaIranIraqIrelandIsraelItalyJamaicaJapanJordanKazakhstanKenyaKoreaKuwaitLaosLatin AmericaLatviaLebanonLiberiaLithuaniaMalaysiaMexicoMicronesiaMiddle AfricaMoldovaMoroccoNepalNetherlandsNicaraguaNigeriaNorth AmericaNorth MacedoniaNorthern AfricaNorthern EuropeNorwayOceaniaPakistanPanamaPeruPhilippinesPolandPortugalRomaniaRussiaSaudi ArabiaScotlandSenegalSerbiaSierra LeoneSingaporeSomaliaSouth AfricaSouth AmericaSouth Central AsiaSouth Eastern AsiaSouthern EuropeSpainSri LankaSt. Vincent and the GrenadinesSudanSwedenSwitzerlandSyriaTaiwanThailandTrinidad and TobagoTurkeyUgandaUkraineUruguayUzbekistanVenezuelaVietnamWest IndiesWestern AfricaWestern AsiaWestern EuropeYemenZaireZimbabweAzores
Disability Age Under 5
Income
Poverty
Unemployment
Labor Participation
Family Structure
Vehicle Availability
Education Level
Disability

French Canadian Disability Age Under 5
Tragic

1.9%
DISABILITY | AGE UNDER 5
0.0/ 100
METRIC RATING
331st/ 347
METRIC RANK

French Canadian Disability Age Under 5 Correlation Chart

The statistical analysis conducted on geographies consisting of 244,253,201 people shows a strong positive correlation between the proportion of French Canadians and percentage of population with a disability under the age of 5 in the United States with a correlation coefficient (R) of 0.752 and weighted average of 1.9%. On average, for every 1% (one percent) increase in French Canadians within a typical geography, there is an increase of 1.2% in percentage of population with a disability under the age of 5.
French Canadian Disability Age Under 5
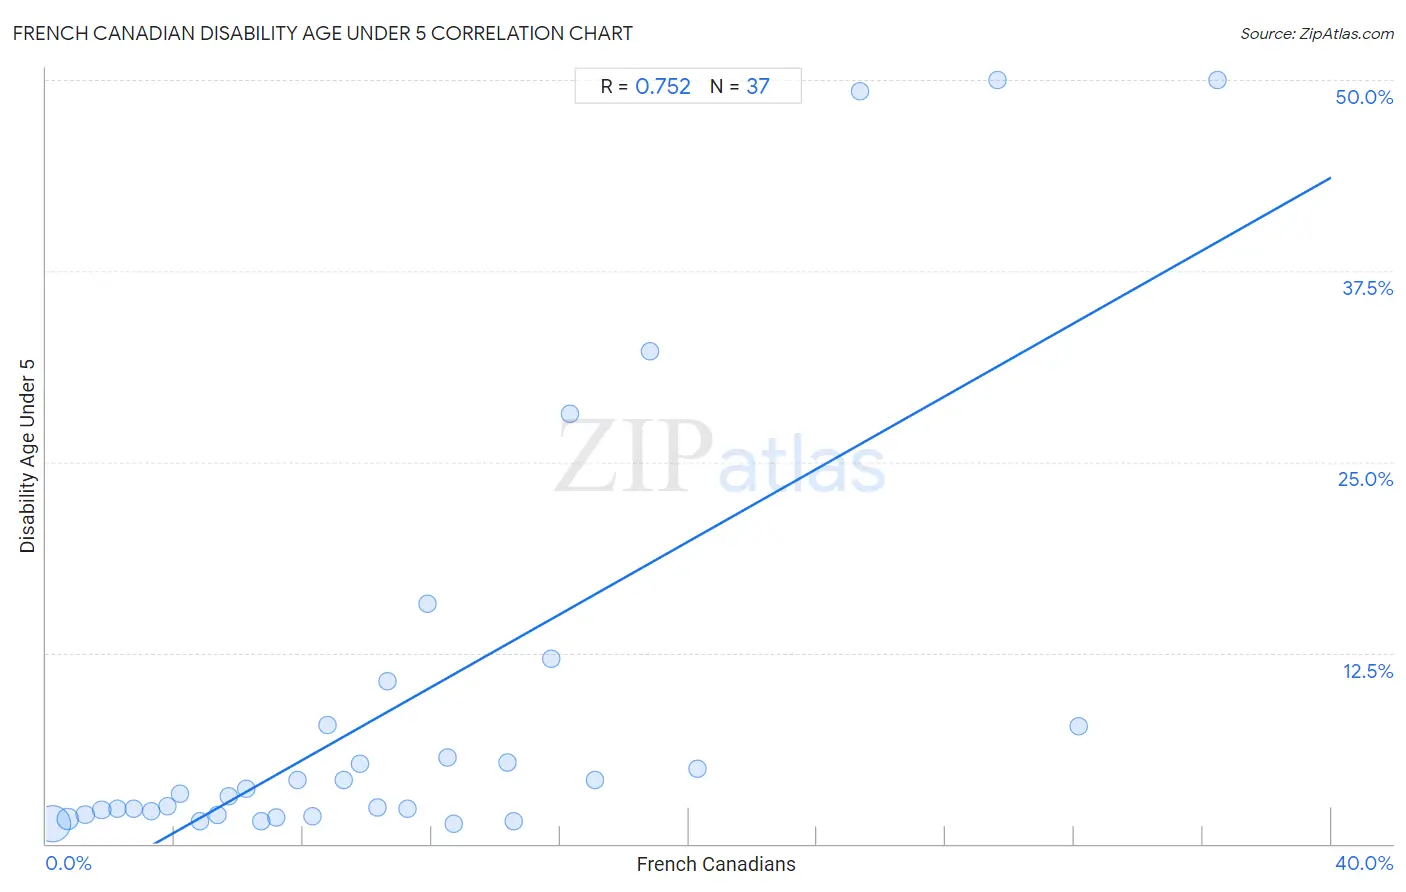
It is essential to understand that the correlation between the percentage of French Canadians and percentage of population with a disability under the age of 5 does not imply a direct cause-and-effect relationship. It remains uncertain whether the presence of French Canadians influences an upward or downward trend in the level of percentage of population with a disability under the age of 5 within an area, or if French Canadians simply ended up residing in those areas with higher or lower levels of percentage of population with a disability under the age of 5 due to other factors.

Demographics Similar to French Canadians by Disability Age Under 5

In terms of disability age under 5, the demographic groups most similar to French Canadians are Chippewa (1.9%, a difference of 0.060%), Choctaw (1.9%, a difference of 0.30%), Houma (1.9%, a difference of 0.62%), American (1.9%, a difference of 1.1%), and Osage (1.8%, a difference of 2.8%).
DemographicsRating | RankDisability Age Under 5
Cherokee
0.0
/100
|
#324
Tragic
1.8%
Immigrants from Portugal
0.0
/100
|
#325
Tragic
1.8%
Sioux
0.0
/100
|
#326
Tragic
1.8%
Osage
0.0
/100
|
#327
Tragic
1.8%
Americans
0.0
/100
|
#328
Tragic
1.9%
Houma
0.0
/100
|
#329
Tragic
1.9%
Choctaw
0.0
/100
|
#330
Tragic
1.9%
French Canadians
0.0
/100
|
#331
Tragic
1.9%
Chippewa
0.0
/100
|
#332
Tragic
1.9%
Dutch West Indians
0.0
/100
|
#333
Tragic
1.9%
Natives/Alaskans
0.0
/100
|
#334
Tragic
1.9%
Pennsylvania Germans
0.0
/100
|
#335
Tragic
1.9%
Paraguayans
0.0
/100
|
#336
Tragic
2.0%
Apache
0.0
/100
|
#337
Tragic
2.0%
Tohono O'odham
0.0
/100
|
#338
Tragic
2.2%

French Canadian Disability Age Under 5 Correlation Summary

MeasurementFrench Canadian DataDisability Age Under 5 Data
Minimum0.20%1.3%
Maximum36.5%50.0%
Range36.3%48.7%
Mean11.1%9.2%
Median9.3%3.3%
Interquartile 25% (IQ1)4.5%1.9%
Interquartile 75% (IQ3)15.1%7.7%
Interquartile Range (IQR)10.6%5.8%
Standard Deviation (Sample)8.8%14.0%
Standard Deviation (Population)8.7%13.8%

Correlation Details

French Canadian PercentileSample SizeDisability Age Under 5
[
0.0%
-
0.5%
]
0.20%
192,592,7561.3%
[
0.5%
-
1.0%
]
0.67%
34,106,7231.6%
[
1.0%
-
1.5%
]
1.21%
8,073,0311.9%
[
1.5%
-
2.0%
]
1.72%
2,741,6982.2%
[
2.0%
-
2.5%
]
2.22%
1,554,7002.3%
[
2.5%
-
3.0%
]
2.71%
1,092,2002.3%
[
3.0%
-
3.5%
]
3.27%
890,0482.1%
[
3.5%
-
4.0%
]
3.76%
775,2832.4%
[
4.0%
-
4.5%
]
4.18%
174,5703.3%
[
4.5%
-
5.0%
]
4.80%
385,6291.5%
[
5.0%
-
5.5%
]
5.34%
263,4441.9%
[
5.5%
-
6.0%
]
5.69%
101,9703.1%
[
6.0%
-
6.5%
]
6.22%
228,6853.6%
[
6.5%
-
7.0%
]
6.70%
137,9641.5%
[
7.0%
-
7.5%
]
7.15%
173,8361.7%
[
7.5%
-
8.0%
]
7.83%
64,6924.2%
[
8.0%
-
8.5%
]
8.30%
218,1771.8%
[
8.5%
-
9.0%
]
8.74%
58,2237.8%
[
9.0%
-
9.5%
]
9.27%
99,3294.2%
[
9.5%
-
10.0%
]
9.75%
50,6115.3%
[
10.0%
-
10.5%
]
10.32%
200,4792.4%
[
10.5%
-
11.0%
]
10.64%
1,23110.6%
[
11.0%
-
11.5%
]
11.24%
31,1392.3%
[
11.5%
-
12.0%
]
11.88%
8,37715.7%
[
12.0%
-
12.5%
]
12.47%
20,7125.7%
[
12.5%
-
13.0%
]
12.67%
120,4731.3%
[
14.0%
-
14.5%
]
14.35%
7,6385.3%
[
14.5%
-
15.0%
]
14.56%
14,1651.4%
[
15.5%
-
16.0%
]
15.71%
8,12312.1%
[
16.0%
-
16.5%
]
16.32%
1,85728.1%
[
17.0%
-
17.5%
]
17.10%
48,0764.2%
[
18.5%
-
19.0%
]
18.79%
2,59732.2%
[
20.0%
-
20.5%
]
20.29%
2,1644.9%
[
25.0%
-
25.5%
]
25.34%
1,61849.3%
[
29.5%
-
30.0%
]
29.59%
41950.0%
[
32.0%
-
32.5%
]
32.14%
2247.7%
[
36.0%
-
36.5%
]
36.47%
34050.0%