Tongan Disability Age Under 5
COMPARE
Tongan
Select to Compare
Disability Age Under 5
Tongan Disability Age Under 5
1.3%
DISABILITY | AGE UNDER 5
4.2/ 100
METRIC RATING
233rd/ 347
METRIC RANK
Tongan Disability Age Under 5 Correlation Chart
The statistical analysis conducted on geographies consisting of 77,388,700 people shows a moderate positive correlation between the proportion of Tongans and percentage of population with a disability under the age of 5 in the United States with a correlation coefficient (R) of 0.430 and weighted average of 1.3%. On average, for every 1% (one percent) increase in Tongans within a typical geography, there is an increase of 0.78% in percentage of population with a disability under the age of 5.
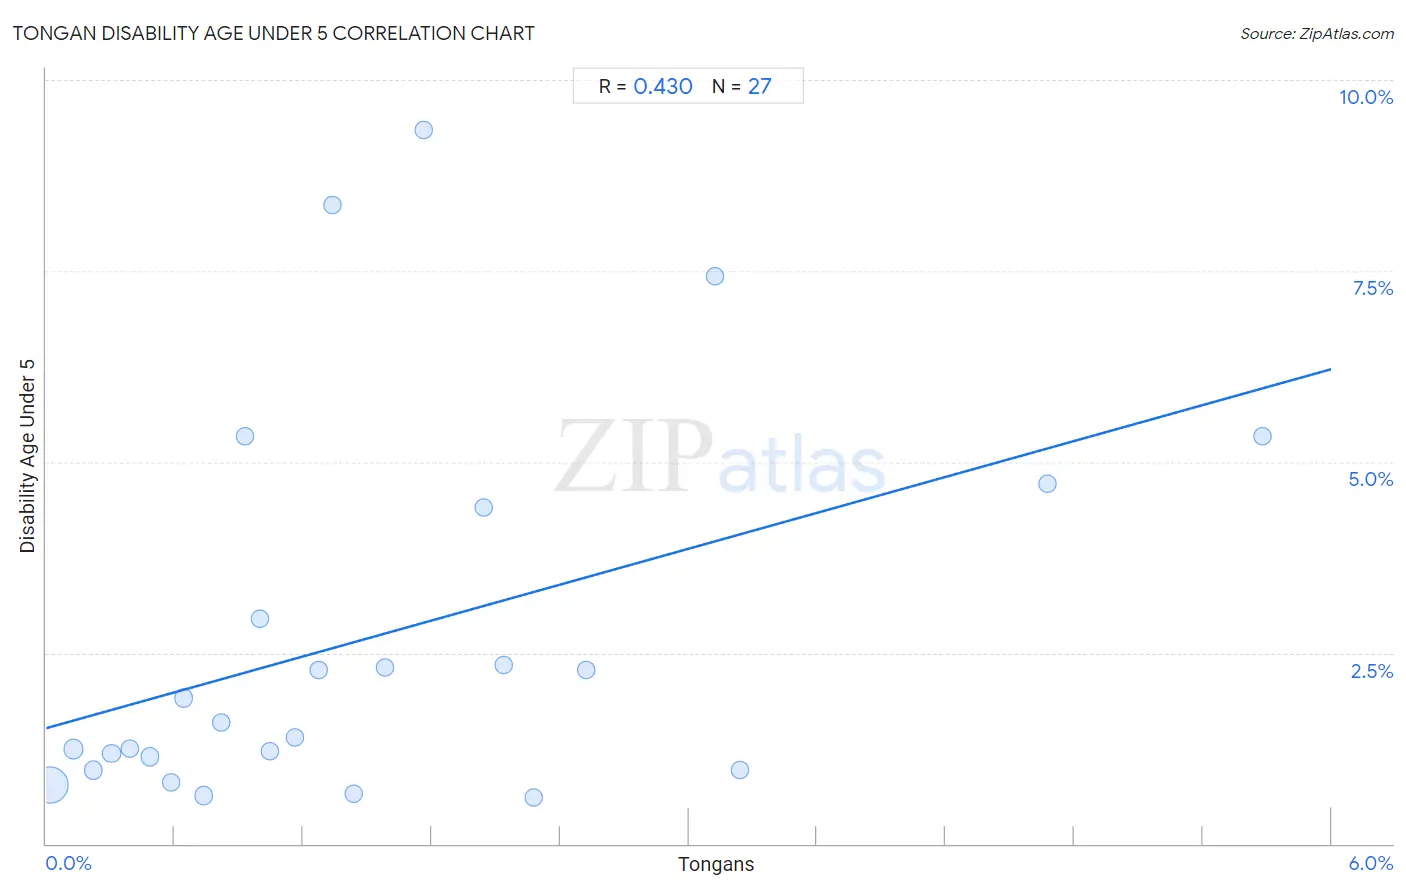
It is essential to understand that the correlation between the percentage of Tongans and percentage of population with a disability under the age of 5 does not imply a direct cause-and-effect relationship. It remains uncertain whether the presence of Tongans influences an upward or downward trend in the level of percentage of population with a disability under the age of 5 within an area, or if Tongans simply ended up residing in those areas with higher or lower levels of percentage of population with a disability under the age of 5 due to other factors.
Demographics Similar to Tongans by Disability Age Under 5
In terms of disability age under 5, the demographic groups most similar to Tongans are French American Indian (1.3%, a difference of 0.12%), Immigrants from Northern Europe (1.3%, a difference of 0.25%), Pueblo (1.3%, a difference of 0.26%), Central American Indian (1.3%, a difference of 0.33%), and Lebanese (1.3%, a difference of 0.49%).
| Demographics | Rating | Rank | Disability Age Under 5 |
| Bahamians | 7.1 /100 | #226 | Tragic 1.3% |
| Taiwanese | 6.1 /100 | #227 | Tragic 1.3% |
| Luxembourgers | 6.1 /100 | #228 | Tragic 1.3% |
| Immigrants from Costa Rica | 5.5 /100 | #229 | Tragic 1.3% |
| Lebanese | 5.3 /100 | #230 | Tragic 1.3% |
| Immigrants from Northern Europe | 4.7 /100 | #231 | Tragic 1.3% |
| French American Indians | 4.5 /100 | #232 | Tragic 1.3% |
| Tongans | 4.2 /100 | #233 | Tragic 1.3% |
| Pueblo | 3.8 /100 | #234 | Tragic 1.3% |
| Central American Indians | 3.6 /100 | #235 | Tragic 1.3% |
| South American Indians | 3.3 /100 | #236 | Tragic 1.3% |
| Basques | 3.0 /100 | #237 | Tragic 1.3% |
| Spanish American Indians | 2.4 /100 | #238 | Tragic 1.3% |
| Immigrants from Austria | 2.3 /100 | #239 | Tragic 1.3% |
| Native Hawaiians | 2.2 /100 | #240 | Tragic 1.3% |
Tongan Disability Age Under 5 Correlation Summary
| Measurement | Tongan Data | Disability Age Under 5 Data |
| Minimum | 0.020% | 0.61% |
| Maximum | 5.7% | 9.3% |
| Range | 5.7% | 8.7% |
| Mean | 1.5% | 2.7% |
| Median | 1.2% | 1.6% |
| Interquartile 25% (IQ1) | 0.58% | 0.97% |
| Interquartile 75% (IQ3) | 2.1% | 4.4% |
| Interquartile Range (IQR) | 1.5% | 3.4% |
| Standard Deviation (Sample) | 1.4% | 2.5% |
| Standard Deviation (Population) | 1.3% | 2.4% |
Correlation Details
| Tongan Percentile | Sample Size | Disability Age Under 5 |
[ 0.0% - 0.5% ] 0.020% | 61,442,420 | 0.77% |
[ 0.0% - 0.5% ] 0.13% | 6,069,191 | 1.2% |
[ 0.0% - 0.5% ] 0.22% | 2,840,447 | 0.96% |
[ 0.0% - 0.5% ] 0.31% | 2,191,161 | 1.2% |
[ 0.0% - 0.5% ] 0.39% | 968,051 | 1.2% |
[ 0.0% - 0.5% ] 0.48% | 534,190 | 1.1% |
[ 0.5% - 1.0% ] 0.58% | 759,767 | 0.80% |
[ 0.5% - 1.0% ] 0.64% | 437,429 | 1.9% |
[ 0.5% - 1.0% ] 0.73% | 330,979 | 0.63% |
[ 0.5% - 1.0% ] 0.82% | 181,960 | 1.6% |
[ 0.5% - 1.0% ] 0.93% | 47,809 | 5.3% |
[ 0.5% - 1.0% ] 1.00% | 142,347 | 3.0% |
[ 1.0% - 1.5% ] 1.05% | 276,548 | 1.2% |
[ 1.0% - 1.5% ] 1.16% | 412,769 | 1.4% |
[ 1.0% - 1.5% ] 1.27% | 72,121 | 2.3% |
[ 1.0% - 1.5% ] 1.33% | 32,596 | 8.4% |
[ 1.0% - 1.5% ] 1.44% | 173,682 | 0.66% |
[ 1.5% - 2.0% ] 1.58% | 74,648 | 2.3% |
[ 1.5% - 2.0% ] 1.76% | 26,315 | 9.3% |
[ 2.0% - 2.5% ] 2.04% | 13,919 | 4.4% |
[ 2.0% - 2.5% ] 2.13% | 86,587 | 2.3% |
[ 2.0% - 2.5% ] 2.27% | 138,868 | 0.61% |
[ 2.5% - 3.0% ] 2.52% | 35,392 | 2.3% |
[ 3.0% - 3.5% ] 3.12% | 3,264 | 7.4% |
[ 3.0% - 3.5% ] 3.24% | 88,092 | 0.97% |
[ 4.5% - 5.0% ] 4.68% | 4,555 | 4.7% |
[ 5.5% - 6.0% ] 5.68% | 3,593 | 5.3% |