Filipino Disability Age Under 5

COMPARE

Filipino
Race
Ancestry
AfghanAfricanAlaska NativeAlaskan AthabascanAlbanianAleutAlsatianAmericanApacheArabArapahoArgentineanArmenianAssyrian/Chaldean/SyriacAustralianAustrianBahamianBangladeshiBarbadianBasqueBelgianBelizeanBermudanBhutaneseBlackfeetBolivianBrazilianBritishBritish West IndianBulgarianBurmeseCajunCambodianCanadianCape VerdeanCarpatho RusynCelticCentral AmericanCentral American IndianCherokeeCheyenneChickasawChileanChineseChippewaChoctawColombianColvilleComancheCosta RicanCreeCreekCroatianCrowCubanCypriotCzechCzechoslovakianDanishDelawareDominicanDutchDutch West IndianEastern EuropeanEcuadorianEgyptianEnglishEstonianEthiopianEuropeanFijianFilipinoFinnishFrenchFrench American IndianFrench CanadianGermanGerman RussianGhanaianGreekGuamanian/ChamorroGuatemalanGuyaneseHaitianHmongHonduranHopiHoumaHungarianIcelanderIndian (Asian)IndonesianInupiatIranianIraqiIrishIroquoisIsraeliItalianJamaicanJapaneseJordanianKenyanKiowaKoreanLaotianLatvianLebaneseLiberianLithuanianLumbeeLuxembourgerMacedonianMalaysianMalteseMarshalleseMenomineeMexicanMexican American IndianMongolianMoroccanNative HawaiianNavajoNepaleseNew ZealanderNicaraguanNigerianNorthern EuropeanNorwegianOkinawanOsageOttawaPaiutePakistaniPalestinianPanamanianParaguayanPennsylvania GermanPeruvianPimaPolishPortuguesePotawatomiPuebloPuerto RicanPuget Sound SalishRomanianRussianSalvadoranSamoanScandinavianScotch-IrishScottishSeminoleSenegaleseSerbianShoshoneSierra LeoneanSiouxSlavicSlovakSloveneSomaliSouth AfricanSouth AmericanSouth American IndianSoviet UnionSpaniardSpanishSpanish AmericanSpanish American IndianSri LankanSubsaharan AfricanSudaneseSwedishSwissSyrianTaiwaneseThaiTlingit-HaidaTohono O'OdhamTonganTrinidadian and TobagonianTsimshianTurkishU.S. Virgin IslanderUgandanUkrainianUruguayanUteVenezuelanVietnameseWelshWest IndianYakamaYaquiYugoslavianYumanYup'ikZimbabwean
Immigration
NonimmigrantsImmigrantsAfghanistanAfricaAlbaniaArgentinaArmeniaAsiaAustraliaAustriaBahamasBangladeshBarbadosBelarusBelgiumBelizeBoliviaBosnia and HerzegovinaBrazilBulgariaBurma/MyanmarCabo VerdeCambodiaCameroonCanadaCaribbeanCentral AmericaChileChinaColombiaCongoCosta RicaCroatiaCubaCzechoslovakiaDenmarkDominicaDominican RepublicEastern AfricaEastern AsiaEastern EuropeEcuadorEgyptEl SalvadorEnglandEritreaEthiopiaEuropeFijiFranceGermanyGhanaGreeceGrenadaGuatemalaGuyanaHaitiHondurasHong KongHungaryIndiaIndonesiaIranIraqIrelandIsraelItalyJamaicaJapanJordanKazakhstanKenyaKoreaKuwaitLaosLatin AmericaLatviaLebanonLiberiaLithuaniaMalaysiaMexicoMicronesiaMiddle AfricaMoldovaMoroccoNepalNetherlandsNicaraguaNigeriaNorth AmericaNorth MacedoniaNorthern AfricaNorthern EuropeNorwayOceaniaPakistanPanamaPeruPhilippinesPolandPortugalRomaniaRussiaSaudi ArabiaScotlandSenegalSerbiaSierra LeoneSingaporeSomaliaSouth AfricaSouth AmericaSouth Central AsiaSouth Eastern AsiaSouthern EuropeSpainSri LankaSt. Vincent and the GrenadinesSudanSwedenSwitzerlandSyriaTaiwanThailandTrinidad and TobagoTurkeyUgandaUkraineUruguayUzbekistanVenezuelaVietnamWest IndiesWestern AfricaWestern AsiaWestern EuropeYemenZaireZimbabweAzores
Select to Compare
Race
Ancestry
AfghanAfricanAlaska NativeAlaskan AthabascanAlbanianAleutAlsatianAmericanApacheArabArapahoArgentineanArmenianAssyrian/Chaldean/SyriacAustralianAustrianBahamianBangladeshiBarbadianBasqueBelgianBelizeanBermudanBhutaneseBlackfeetBolivianBrazilianBritishBritish West IndianBulgarianBurmeseCajunCambodianCanadianCape VerdeanCarpatho RusynCelticCentral AmericanCentral American IndianCherokeeCheyenneChickasawChileanChineseChippewaChoctawColombianColvilleComancheCosta RicanCreeCreekCroatianCrowCubanCypriotCzechCzechoslovakianDanishDelawareDominicanDutchDutch West IndianEastern EuropeanEcuadorianEgyptianEnglishEstonianEthiopianEuropeanFijianFinnishFrenchFrench American IndianFrench CanadianGermanGerman RussianGhanaianGreekGuamanian/ChamorroGuatemalanGuyaneseHaitianHmongHonduranHopiHoumaHungarianIcelanderIndian (Asian)IndonesianInupiatIranianIraqiIrishIroquoisIsraeliItalianJamaicanJapaneseJordanianKenyanKiowaKoreanLaotianLatvianLebaneseLiberianLithuanianLumbeeLuxembourgerMacedonianMalaysianMalteseMarshalleseMenomineeMexicanMexican American IndianMongolianMoroccanNative HawaiianNavajoNepaleseNew ZealanderNicaraguanNigerianNorthern EuropeanNorwegianOkinawanOsageOttawaPaiutePakistaniPalestinianPanamanianParaguayanPennsylvania GermanPeruvianPimaPolishPortuguesePotawatomiPuebloPuerto RicanPuget Sound SalishRomanianRussianSalvadoranSamoanScandinavianScotch-IrishScottishSeminoleSenegaleseSerbianShoshoneSierra LeoneanSiouxSlavicSlovakSloveneSomaliSouth AfricanSouth AmericanSouth American IndianSoviet UnionSpaniardSpanishSpanish AmericanSpanish American IndianSri LankanSubsaharan AfricanSudaneseSwedishSwissSyrianTaiwaneseThaiTlingit-HaidaTohono O'OdhamTonganTrinidadian and TobagonianTsimshianTurkishU.S. Virgin IslanderUgandanUkrainianUruguayanUteVenezuelanVietnameseWelshWest IndianYakamaYaquiYugoslavianYumanYup'ikZimbabwean
Immigration
NonimmigrantsImmigrantsAfghanistanAfricaAlbaniaArgentinaArmeniaAsiaAustraliaAustriaBahamasBangladeshBarbadosBelarusBelgiumBelizeBoliviaBosnia and HerzegovinaBrazilBulgariaBurma/MyanmarCabo VerdeCambodiaCameroonCanadaCaribbeanCentral AmericaChileChinaColombiaCongoCosta RicaCroatiaCubaCzechoslovakiaDenmarkDominicaDominican RepublicEastern AfricaEastern AsiaEastern EuropeEcuadorEgyptEl SalvadorEnglandEritreaEthiopiaEuropeFijiFranceGermanyGhanaGreeceGrenadaGuatemalaGuyanaHaitiHondurasHong KongHungaryIndiaIndonesiaIranIraqIrelandIsraelItalyJamaicaJapanJordanKazakhstanKenyaKoreaKuwaitLaosLatin AmericaLatviaLebanonLiberiaLithuaniaMalaysiaMexicoMicronesiaMiddle AfricaMoldovaMoroccoNepalNetherlandsNicaraguaNigeriaNorth AmericaNorth MacedoniaNorthern AfricaNorthern EuropeNorwayOceaniaPakistanPanamaPeruPhilippinesPolandPortugalRomaniaRussiaSaudi ArabiaScotlandSenegalSerbiaSierra LeoneSingaporeSomaliaSouth AfricaSouth AmericaSouth Central AsiaSouth Eastern AsiaSouthern EuropeSpainSri LankaSt. Vincent and the GrenadinesSudanSwedenSwitzerlandSyriaTaiwanThailandTrinidad and TobagoTurkeyUgandaUkraineUruguayUzbekistanVenezuelaVietnamWest IndiesWestern AfricaWestern AsiaWestern EuropeYemenZaireZimbabweAzores
Disability Age Under 5
Income
Poverty
Unemployment
Labor Participation
Family Structure
Vehicle Availability
Education Level
Disability

Filipino Disability Age Under 5
Exceptional

1.1%
DISABILITY | AGE UNDER 5
99.9/ 100
METRIC RATING
39th/ 347
METRIC RANK

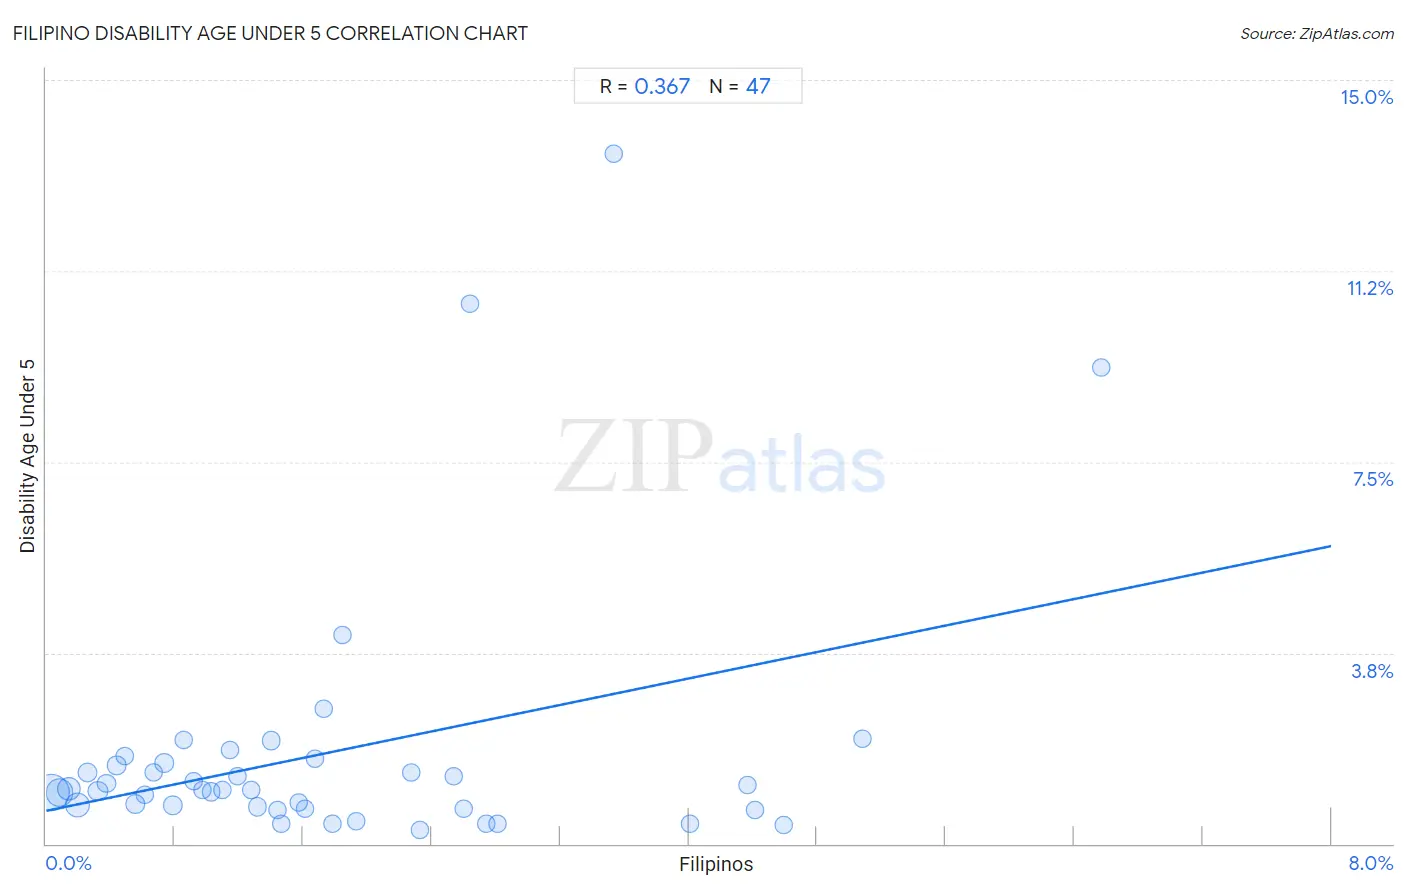
Filipino Disability Age Under 5 Correlation Chart

The statistical analysis conducted on geographies consisting of 154,851,342 people shows a mild positive correlation between the proportion of Filipinos and percentage of population with a disability under the age of 5 in the United States with a correlation coefficient (R) of 0.367 and weighted average of 1.1%. On average, for every 1% (one percent) increase in Filipinos within a typical geography, there is an increase of 0.65% in percentage of population with a disability under the age of 5.
Filipino Disability Age Under 5
It is essential to understand that the correlation between the percentage of Filipinos and percentage of population with a disability under the age of 5 does not imply a direct cause-and-effect relationship. It remains uncertain whether the presence of Filipinos influences an upward or downward trend in the level of percentage of population with a disability under the age of 5 within an area, or if Filipinos simply ended up residing in those areas with higher or lower levels of percentage of population with a disability under the age of 5 due to other factors.

Demographics Similar to Filipinos by Disability Age Under 5

In terms of disability age under 5, the demographic groups most similar to Filipinos are Immigrants from Albania (1.1%, a difference of 0.33%), Immigrants from Guyana (1.0%, a difference of 0.67%), Thai (1.1%, a difference of 0.74%), Immigrants from India (1.0%, a difference of 0.76%), and Immigrants from Nepal (1.0%, a difference of 0.78%).
DemographicsRating | RankDisability Age Under 5
Iranians
99.9
/100
|
#32
Exceptional
1.0%
Bolivians
99.9
/100
|
#33
Exceptional
1.0%
Immigrants from Ukraine
99.9
/100
|
#34
Exceptional
1.0%
Barbadians
99.9
/100
|
#35
Exceptional
1.0%
Immigrants from Nepal
99.9
/100
|
#36
Exceptional
1.0%
Immigrants from India
99.9
/100
|
#37
Exceptional
1.0%
Immigrants from Guyana
99.9
/100
|
#38
Exceptional
1.0%
Filipinos
99.9
/100
|
#39
Exceptional
1.1%
Immigrants from Albania
99.9
/100
|
#40
Exceptional
1.1%
Thais
99.8
/100
|
#41
Exceptional
1.1%
Immigrants from Bulgaria
99.8
/100
|
#42
Exceptional
1.1%
Pima
99.8
/100
|
#43
Exceptional
1.1%
Immigrants from Asia
99.8
/100
|
#44
Exceptional
1.1%
Immigrants from Turkey
99.8
/100
|
#45
Exceptional
1.1%
Immigrants from Congo
99.8
/100
|
#46
Exceptional
1.1%

Filipino Disability Age Under 5 Correlation Summary

MeasurementFilipino DataDisability Age Under 5 Data
Minimum0.029%0.27%
Maximum6.6%13.6%
Range6.5%13.3%
Mean1.8%1.8%
Median1.4%1.1%
Interquartile 25% (IQ1)0.67%0.69%
Interquartile 75% (IQ3)2.5%1.6%
Interquartile Range (IQR)1.9%0.90%
Standard Deviation (Sample)1.5%2.6%
Standard Deviation (Population)1.5%2.6%

Correlation Details

Filipino PercentileSample SizeDisability Age Under 5
[
0.0%
-
0.5%
]
0.029%
61,084,1691.0%
[
0.0%
-
0.5%
]
0.083%
31,677,9211.0%
[
0.0%
-
0.5%
]
0.14%
15,740,4671.1%
[
0.0%
-
0.5%
]
0.20%
20,174,2880.76%
[
0.0%
-
0.5%
]
0.26%
4,070,3481.4%
[
0.0%
-
0.5%
]
0.32%
5,317,2131.0%
[
0.0%
-
0.5%
]
0.37%
2,311,5911.2%
[
0.0%
-
0.5%
]
0.44%
1,437,9991.5%
[
0.0%
-
0.5%
]
0.49%
1,391,7721.7%
[
0.5%
-
1.0%
]
0.56%
2,142,4000.78%
[
0.5%
-
1.0%
]
0.61%
1,314,4840.95%
[
0.5%
-
1.0%
]
0.67%
687,5701.4%
[
0.5%
-
1.0%
]
0.73%
862,2311.6%
[
0.5%
-
1.0%
]
0.79%
1,895,1540.75%
[
0.5%
-
1.0%
]
0.86%
348,5872.0%
[
0.5%
-
1.0%
]
0.92%
329,3901.2%
[
0.5%
-
1.0%
]
0.97%
322,4291.1%
[
1.0%
-
1.5%
]
1.03%
341,0621.0%
[
1.0%
-
1.5%
]
1.10%
530,2331.1%
[
1.0%
-
1.5%
]
1.15%
38,1241.8%
[
1.0%
-
1.5%
]
1.19%
197,3641.3%
[
1.0%
-
1.5%
]
1.27%
263,1491.1%
[
1.0%
-
1.5%
]
1.31%
474,2670.72%
[
1.0%
-
1.5%
]
1.40%
111,4222.0%
[
1.0%
-
1.5%
]
1.44%
161,7940.67%
[
1.0%
-
1.5%
]
1.47%
67,9010.40%
[
1.5%
-
2.0%
]
1.57%
53,3200.80%
[
1.5%
-
2.0%
]
1.61%
132,1720.69%
[
1.5%
-
2.0%
]
1.67%
96,0261.7%
[
1.5%
-
2.0%
]
1.73%
31,4552.6%
[
1.5%
-
2.0%
]
1.78%
254,5060.40%
[
1.5%
-
2.0%
]
1.84%
8,4174.1%
[
1.5%
-
2.0%
]
1.93%
82,1320.43%
[
2.0%
-
2.5%
]
2.28%
35,5561.4%
[
2.0%
-
2.5%
]
2.33%
363,9130.27%
[
2.5%
-
3.0%
]
2.54%
36,1651.3%
[
2.5%
-
3.0%
]
2.60%
110,9500.69%
[
2.5%
-
3.0%
]
2.64%
11,09110.6%
[
2.5%
-
3.0%
]
2.74%
61,4140.38%
[
2.5%
-
3.0%
]
2.81%
59,7630.40%
[
3.5%
-
4.0%
]
3.54%
22,65413.6%
[
4.0%
-
4.5%
]
4.01%
43,8510.39%
[
4.0%
-
4.5%
]
4.36%
28,2121.1%
[
4.0%
-
4.5%
]
4.42%
41,3770.67%
[
4.5%
-
5.0%
]
4.59%
47,2090.37%
[
5.0%
-
5.5%
]
5.08%
33,3672.1%
[
6.5%
-
7.0%
]
6.57%
4,4639.4%