Tsimshian Disability Age Under 5
COMPARE
Tsimshian
Select to Compare
Disability Age Under 5
Tsimshian Disability Age Under 5
2.4%
DISABILITY | AGE UNDER 5
0.0/ 100
METRIC RATING
341st/ 347
METRIC RANK
Tsimshian Disability Age Under 5 Correlation Chart
The statistical analysis conducted on geographies consisting of 13,579,773 people shows a substantial positive correlation between the proportion of Tsimshian and percentage of population with a disability under the age of 5 in the United States with a correlation coefficient (R) of 0.596 and weighted average of 2.4%. On average, for every 1% (one percent) increase in Tsimshian within a typical geography, there is an increase of 0.033% in percentage of population with a disability under the age of 5.
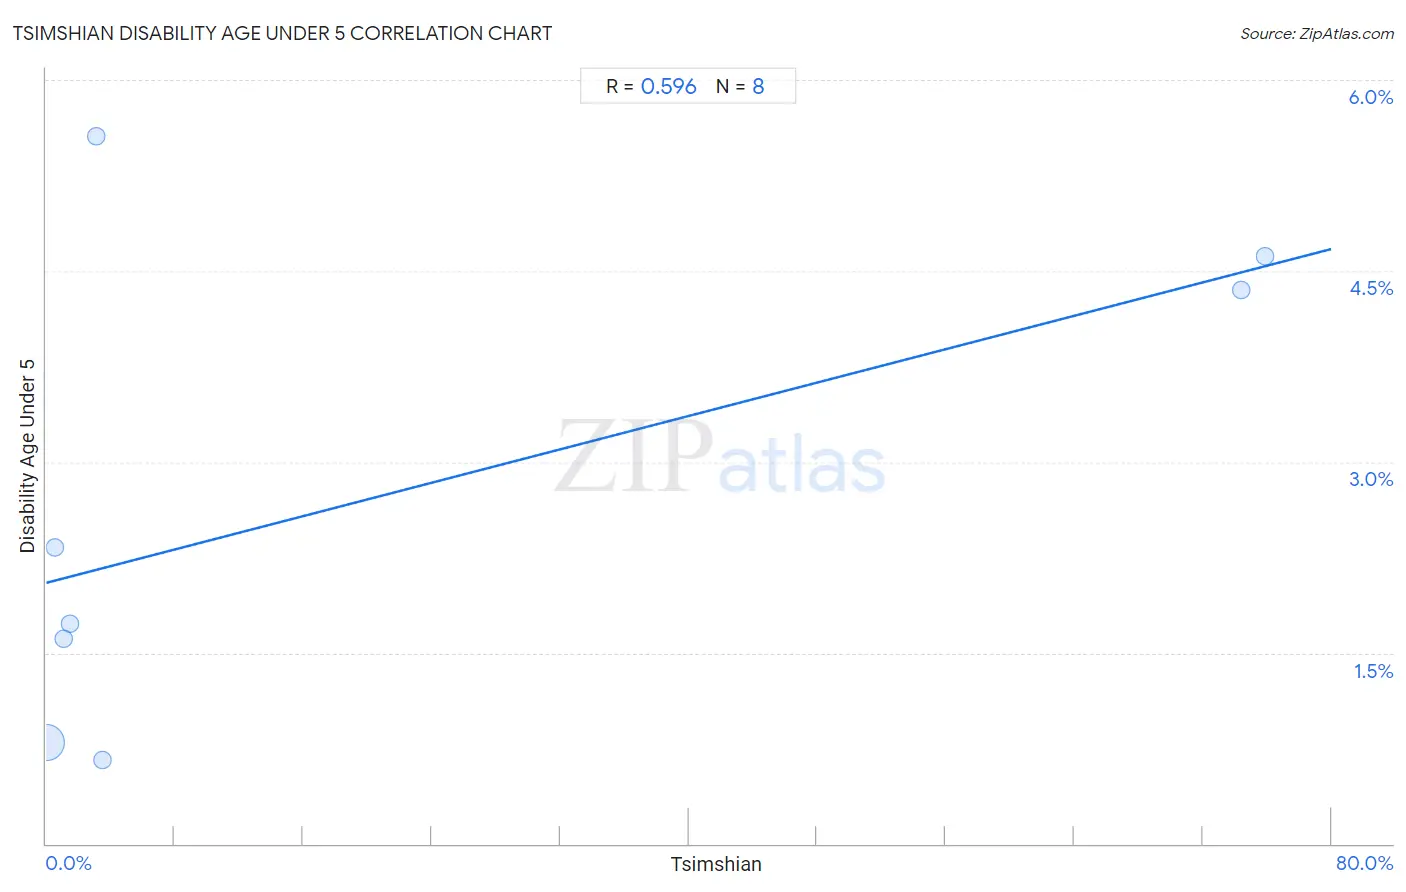
It is essential to understand that the correlation between the percentage of Tsimshian and percentage of population with a disability under the age of 5 does not imply a direct cause-and-effect relationship. It remains uncertain whether the presence of Tsimshian influences an upward or downward trend in the level of percentage of population with a disability under the age of 5 within an area, or if Tsimshian simply ended up residing in those areas with higher or lower levels of percentage of population with a disability under the age of 5 due to other factors.
Demographics Similar to Tsimshian by Disability Age Under 5
In terms of disability age under 5, the demographic groups most similar to Tsimshian are Menominee (2.3%, a difference of 4.9%), Immigrants from the Azores (2.2%, a difference of 7.8%), Tohono O'odham (2.2%, a difference of 10.2%), Apache (2.0%, a difference of 18.5%), and Paraguayan (2.0%, a difference of 22.0%).
| Demographics | Rating | Rank | Disability Age Under 5 |
| Dutch West Indians | 0.0 /100 | #333 | Tragic 1.9% |
| Natives/Alaskans | 0.0 /100 | #334 | Tragic 1.9% |
| Pennsylvania Germans | 0.0 /100 | #335 | Tragic 1.9% |
| Paraguayans | 0.0 /100 | #336 | Tragic 2.0% |
| Apache | 0.0 /100 | #337 | Tragic 2.0% |
| Tohono O'odham | 0.0 /100 | #338 | Tragic 2.2% |
| Immigrants from the Azores | 0.0 /100 | #339 | Tragic 2.2% |
| Menominee | 0.0 /100 | #340 | Tragic 2.3% |
| Tsimshian | 0.0 /100 | #341 | Tragic 2.4% |
| Alaska Natives | 0.0 /100 | #342 | Tragic 2.9% |
| Colville | 0.0 /100 | #343 | Tragic 3.3% |
| Inupiat | 0.0 /100 | #344 | Tragic 3.7% |
| Paiute | 0.0 /100 | #345 | Tragic 3.9% |
| Yup'ik | 0.0 /100 | #346 | Tragic 4.5% |
| Hopi | 0.0 /100 | #347 | Tragic 4.6% |
Tsimshian Disability Age Under 5 Correlation Summary
| Measurement | Tsimshian Data | Disability Age Under 5 Data |
| Minimum | 0.017% | 0.66% |
| Maximum | 75.9% | 5.6% |
| Range | 75.8% | 4.9% |
| Mean | 20.0% | 2.7% |
| Median | 2.3% | 2.0% |
| Interquartile 25% (IQ1) | 0.82% | 1.2% |
| Interquartile 75% (IQ3) | 38.9% | 4.5% |
| Interquartile Range (IQR) | 38.1% | 3.3% |
| Standard Deviation (Sample) | 34.1% | 1.9% |
| Standard Deviation (Population) | 31.9% | 1.8% |
Correlation Details
| Tsimshian Percentile | Sample Size | Disability Age Under 5 |
[ 0.0% - 0.5% ] 0.017% | 13,463,341 | 0.80% |
[ 0.5% - 1.0% ] 0.54% | 95,979 | 2.3% |
[ 1.0% - 1.5% ] 1.10% | 1,727 | 1.6% |
[ 1.0% - 1.5% ] 1.49% | 1,073 | 1.7% |
[ 3.0% - 3.5% ] 3.10% | 838 | 5.6% |
[ 3.0% - 3.5% ] 3.46% | 13,913 | 0.66% |
[ 74.0% - 74.5% ] 74.40% | 1,465 | 4.3% |
[ 75.5% - 76.0% ] 75.85% | 1,437 | 4.6% |