Immigrants from Central America Disability Age Under 5
COMPARE
Immigrants from Central America
Select to Compare
Disability Age Under 5
Immigrants from Central America Disability Age Under 5
1.2%
DISABILITY | AGE UNDER 5
61.4/ 100
METRIC RATING
166th/ 347
METRIC RANK
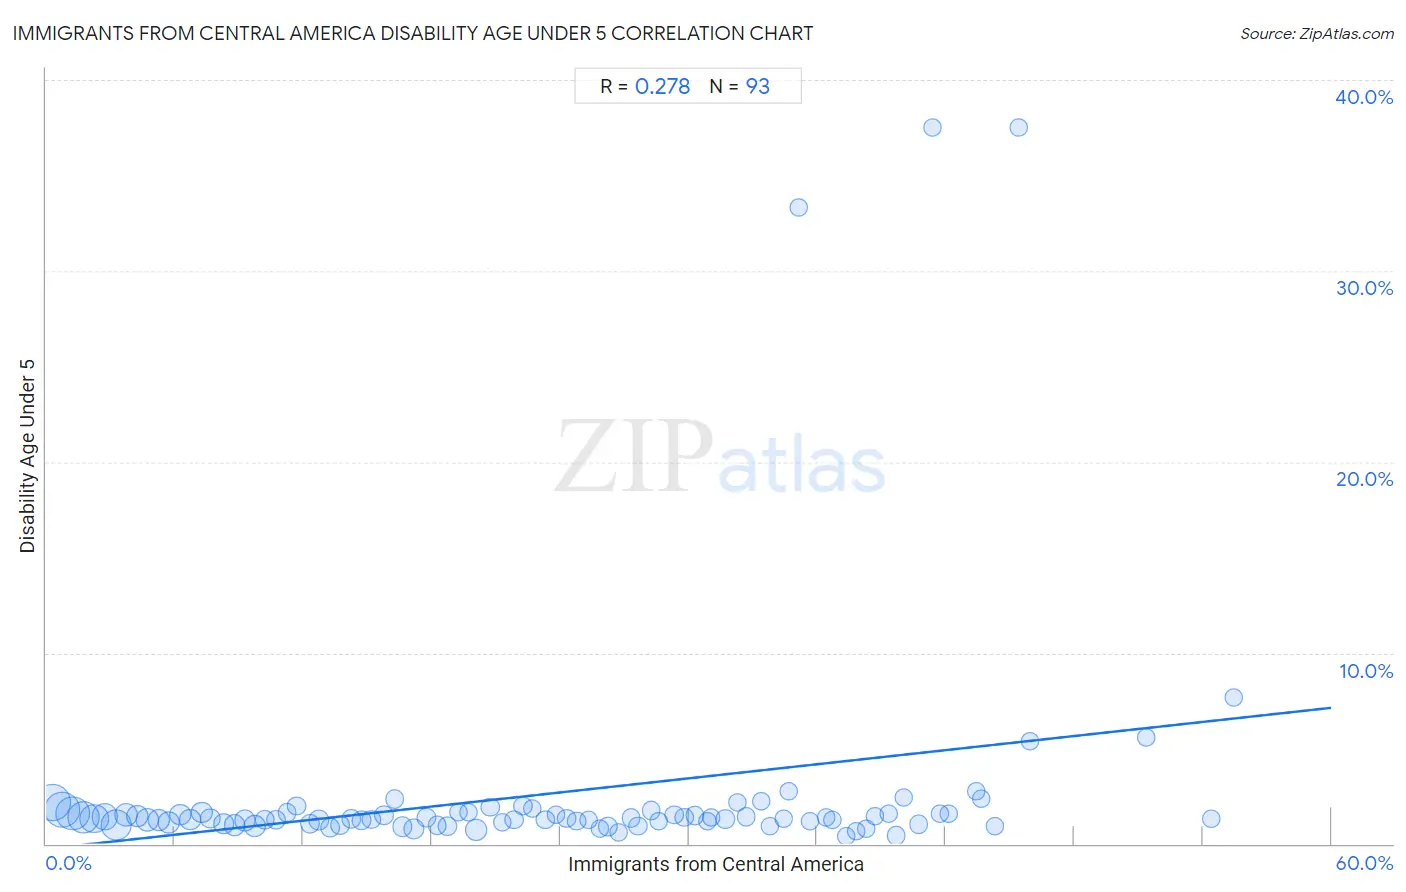
Immigrants from Central America Disability Age Under 5 Correlation Chart
The statistical analysis conducted on geographies consisting of 255,387,809 people shows a weak positive correlation between the proportion of Immigrants from Central America and percentage of population with a disability under the age of 5 in the United States with a correlation coefficient (R) of 0.278 and weighted average of 1.2%. On average, for every 1% (one percent) increase in Immigrants from Central America within a typical geography, there is an increase of 0.12% in percentage of population with a disability under the age of 5.
It is essential to understand that the correlation between the percentage of Immigrants from Central America and percentage of population with a disability under the age of 5 does not imply a direct cause-and-effect relationship. It remains uncertain whether the presence of Immigrants from Central America influences an upward or downward trend in the level of percentage of population with a disability under the age of 5 within an area, or if Immigrants from Central America simply ended up residing in those areas with higher or lower levels of percentage of population with a disability under the age of 5 due to other factors.
Demographics Similar to Immigrants from Central America by Disability Age Under 5
In terms of disability age under 5, the demographic groups most similar to Immigrants from Central America are Immigrants from Kuwait (1.2%, a difference of 0.11%), Immigrants from Argentina (1.2%, a difference of 0.11%), Laotian (1.2%, a difference of 0.13%), Immigrants from Guatemala (1.2%, a difference of 0.18%), and Guatemalan (1.2%, a difference of 0.21%).
| Demographics | Rating | Rank | Disability Age Under 5 |
| Colombians | 65.8 /100 | #159 | Good 1.2% |
| Immigrants from Latin America | 65.8 /100 | #160 | Good 1.2% |
| Immigrants from Africa | 65.1 /100 | #161 | Good 1.2% |
| Guatemalans | 63.6 /100 | #162 | Good 1.2% |
| Immigrants from Guatemala | 63.2 /100 | #163 | Good 1.2% |
| Laotians | 62.8 /100 | #164 | Good 1.2% |
| Immigrants from Kuwait | 62.6 /100 | #165 | Good 1.2% |
| Immigrants from Central America | 61.4 /100 | #166 | Good 1.2% |
| Immigrants from Argentina | 60.2 /100 | #167 | Good 1.2% |
| Sierra Leoneans | 59.1 /100 | #168 | Average 1.2% |
| Immigrants from Uruguay | 59.0 /100 | #169 | Average 1.2% |
| Immigrants from Jamaica | 58.8 /100 | #170 | Average 1.2% |
| Guamanians/Chamorros | 57.8 /100 | #171 | Average 1.2% |
| Crow | 51.0 /100 | #172 | Average 1.2% |
| Immigrants from Ireland | 50.3 /100 | #173 | Average 1.2% |
Immigrants from Central America Disability Age Under 5 Correlation Summary
| Measurement | Immigrants from Central America Data | Disability Age Under 5 Data |
| Minimum | 0.27% | 0.41% |
| Maximum | 55.4% | 37.5% |
| Range | 55.2% | 37.1% |
| Mean | 23.5% | 2.6% |
| Median | 23.3% | 1.3% |
| Interquartile 25% (IQ1) | 11.5% | 1.1% |
| Interquartile 75% (IQ3) | 34.9% | 1.6% |
| Interquartile Range (IQR) | 23.4% | 0.53% |
| Standard Deviation (Sample) | 14.1% | 6.2% |
| Standard Deviation (Population) | 14.0% | 6.2% |
Correlation Details
| Immigrants from Central America Percentile | Sample Size | Disability Age Under 5 |
[ 0.0% - 0.5% ] 0.27% | 26,498,787 | 2.2% |
[ 0.5% - 1.0% ] 0.73% | 25,605,310 | 1.8% |
[ 1.0% - 1.5% ] 1.24% | 22,361,630 | 1.6% |
[ 1.5% - 2.0% ] 1.75% | 19,967,319 | 1.4% |
[ 2.0% - 2.5% ] 2.24% | 14,473,045 | 1.3% |
[ 2.5% - 3.0% ] 2.75% | 11,099,240 | 1.4% |
[ 3.0% - 3.5% ] 3.26% | 17,876,983 | 1.00% |
[ 3.5% - 4.0% ] 3.73% | 7,513,406 | 1.5% |
[ 4.0% - 4.5% ] 4.24% | 5,748,039 | 1.5% |
[ 4.5% - 5.0% ] 4.71% | 7,471,214 | 1.3% |
[ 5.0% - 5.5% ] 5.26% | 5,139,576 | 1.3% |
[ 5.5% - 6.0% ] 5.74% | 5,330,074 | 1.1% |
[ 6.0% - 6.5% ] 6.27% | 4,556,957 | 1.5% |
[ 6.5% - 7.0% ] 6.71% | 4,743,481 | 1.3% |
[ 7.0% - 7.5% ] 7.26% | 3,612,052 | 1.6% |
[ 7.5% - 8.0% ] 7.67% | 2,747,501 | 1.3% |
[ 8.0% - 8.5% ] 8.30% | 3,533,229 | 1.0% |
[ 8.5% - 9.0% ] 8.80% | 4,788,264 | 0.99% |
[ 9.0% - 9.5% ] 9.25% | 3,762,107 | 1.2% |
[ 9.5% - 10.0% ] 9.74% | 6,021,997 | 0.93% |
[ 10.0% - 10.5% ] 10.20% | 2,424,866 | 1.3% |
[ 10.5% - 11.0% ] 10.74% | 2,370,841 | 1.2% |
[ 11.0% - 11.5% ] 11.24% | 1,144,479 | 1.6% |
[ 11.5% - 12.0% ] 11.69% | 730,616 | 2.0% |
[ 12.0% - 12.5% ] 12.30% | 1,751,113 | 1.1% |
[ 12.5% - 13.0% ] 12.71% | 3,345,616 | 1.2% |
[ 13.0% - 13.5% ] 13.26% | 1,364,119 | 0.83% |
[ 13.5% - 14.0% ] 13.74% | 1,559,691 | 0.96% |
[ 14.0% - 14.5% ] 14.26% | 1,551,745 | 1.3% |
[ 14.5% - 15.0% ] 14.73% | 1,021,501 | 1.2% |
[ 15.0% - 15.5% ] 15.16% | 1,426,785 | 1.3% |
[ 15.5% - 16.0% ] 15.76% | 1,077,543 | 1.5% |
[ 16.0% - 16.5% ] 16.27% | 923,614 | 2.3% |
[ 16.5% - 17.0% ] 16.64% | 2,243,387 | 0.90% |
[ 17.0% - 17.5% ] 17.15% | 3,155,740 | 0.78% |
[ 17.5% - 18.0% ] 17.76% | 1,290,683 | 1.4% |
[ 18.0% - 18.5% ] 18.24% | 904,172 | 0.97% |
[ 18.5% - 19.0% ] 18.72% | 1,884,332 | 0.91% |
[ 19.0% - 19.5% ] 19.26% | 813,579 | 1.7% |
[ 19.5% - 20.0% ] 19.73% | 691,772 | 1.6% |
[ 20.0% - 20.5% ] 20.08% | 5,622,424 | 0.72% |
[ 20.5% - 21.0% ] 20.74% | 935,386 | 1.9% |
[ 21.0% - 21.5% ] 21.29% | 535,397 | 1.1% |
[ 21.5% - 22.0% ] 21.84% | 773,763 | 1.2% |
[ 22.0% - 22.5% ] 22.25% | 493,840 | 2.0% |
[ 22.5% - 23.0% ] 22.71% | 615,170 | 1.8% |
[ 23.0% - 23.5% ] 23.29% | 827,382 | 1.3% |
[ 23.5% - 24.0% ] 23.80% | 794,916 | 1.5% |
[ 24.0% - 24.5% ] 24.29% | 801,549 | 1.3% |
[ 24.5% - 25.0% ] 24.76% | 599,312 | 1.2% |
[ 25.0% - 25.5% ] 25.31% | 416,531 | 1.3% |
[ 25.5% - 26.0% ] 25.86% | 371,151 | 0.80% |
[ 26.0% - 26.5% ] 26.22% | 777,934 | 0.89% |
[ 26.5% - 27.0% ] 26.71% | 366,036 | 0.57% |
[ 27.0% - 27.5% ] 27.32% | 402,960 | 1.4% |
[ 27.5% - 28.0% ] 27.62% | 471,652 | 0.93% |
[ 28.0% - 28.5% ] 28.23% | 308,907 | 1.7% |
[ 28.5% - 29.0% ] 28.61% | 184,496 | 1.2% |
[ 29.0% - 29.5% ] 29.32% | 450,213 | 1.5% |
[ 29.5% - 30.0% ] 29.79% | 424,861 | 1.4% |
[ 30.0% - 30.5% ] 30.28% | 236,672 | 1.5% |
[ 30.5% - 31.0% ] 30.86% | 123,533 | 1.2% |
[ 31.0% - 31.5% ] 31.04% | 115,013 | 1.4% |
[ 31.5% - 32.0% ] 31.71% | 758,848 | 1.3% |
[ 32.0% - 32.5% ] 32.25% | 180,134 | 2.1% |
[ 32.5% - 33.0% ] 32.67% | 215,617 | 1.4% |
[ 33.0% - 33.5% ] 33.38% | 79,543 | 2.2% |
[ 33.5% - 34.0% ] 33.77% | 247,585 | 0.93% |
[ 34.0% - 34.5% ] 34.41% | 122,809 | 1.3% |
[ 34.5% - 35.0% ] 34.65% | 60,470 | 2.7% |
[ 35.0% - 35.5% ] 35.11% | 786 | 33.3% |
[ 35.5% - 36.0% ] 35.63% | 88,593 | 1.1% |
[ 36.0% - 36.5% ] 36.43% | 244,848 | 1.4% |
[ 36.5% - 37.0% ] 36.73% | 277,419 | 1.2% |
[ 37.0% - 37.5% ] 37.33% | 137,803 | 0.41% |
[ 37.5% - 38.0% ] 37.82% | 175,089 | 0.68% |
[ 38.0% - 38.5% ] 38.28% | 116,981 | 0.79% |
[ 38.5% - 39.0% ] 38.70% | 131,652 | 1.4% |
[ 39.0% - 39.5% ] 39.32% | 142,276 | 1.6% |
[ 39.5% - 40.0% ] 39.68% | 235,317 | 0.43% |
[ 40.0% - 40.5% ] 40.02% | 60,707 | 2.4% |
[ 40.5% - 41.0% ] 40.73% | 231,893 | 1.0% |
[ 41.0% - 41.5% ] 41.38% | 203 | 37.5% |
[ 41.5% - 42.0% ] 41.71% | 204,522 | 1.6% |
[ 42.0% - 42.5% ] 42.13% | 80,264 | 1.5% |
[ 43.0% - 43.5% ] 43.45% | 23,048 | 2.8% |
[ 43.5% - 44.0% ] 43.66% | 104,160 | 2.3% |
[ 44.0% - 44.5% ] 44.29% | 243,471 | 0.89% |
[ 45.0% - 45.5% ] 45.41% | 185 | 37.5% |
[ 45.5% - 46.0% ] 45.94% | 17,192 | 5.4% |
[ 51.0% - 51.5% ] 51.33% | 5,922 | 5.6% |
[ 54.0% - 54.5% ] 54.39% | 21,778 | 1.3% |
[ 55.0% - 55.5% ] 55.44% | 3,191 | 7.7% |