Immigrants from Moldova Disability Age Under 5
COMPARE
Immigrants from Moldova
Select to Compare
Disability Age Under 5
Immigrants from Moldova Disability Age Under 5
1.1%
DISABILITY | AGE UNDER 5
96.8/ 100
METRIC RATING
95th/ 347
METRIC RANK
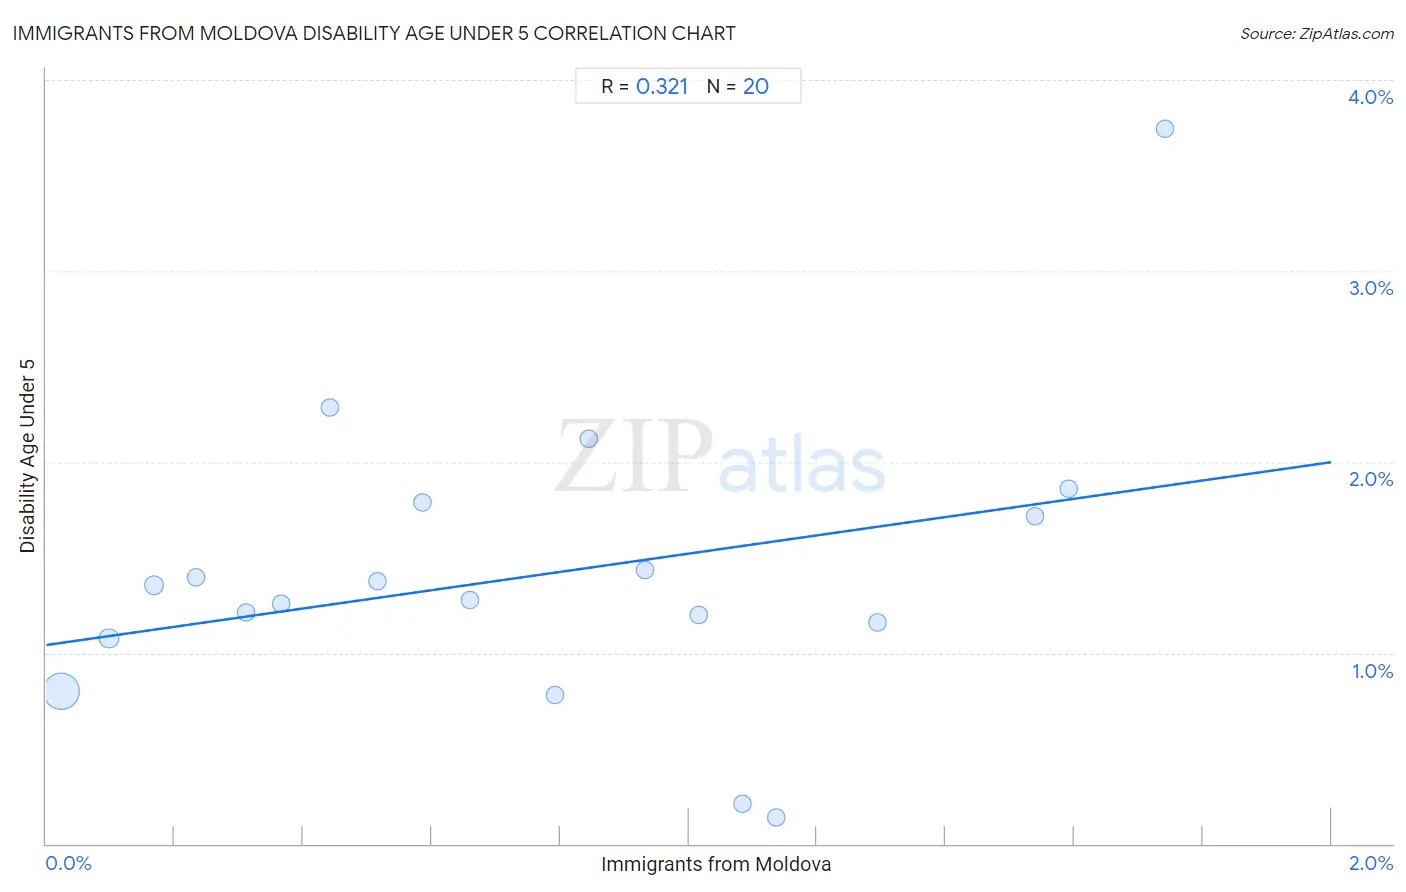
Immigrants from Moldova Disability Age Under 5 Correlation Chart
The statistical analysis conducted on geographies consisting of 88,816,891 people shows a mild positive correlation between the proportion of Immigrants from Moldova and percentage of population with a disability under the age of 5 in the United States with a correlation coefficient (R) of 0.321 and weighted average of 1.1%. On average, for every 1% (one percent) increase in Immigrants from Moldova within a typical geography, there is an increase of 0.48% in percentage of population with a disability under the age of 5.
It is essential to understand that the correlation between the percentage of Immigrants from Moldova and percentage of population with a disability under the age of 5 does not imply a direct cause-and-effect relationship. It remains uncertain whether the presence of Immigrants from Moldova influences an upward or downward trend in the level of percentage of population with a disability under the age of 5 within an area, or if Immigrants from Moldova simply ended up residing in those areas with higher or lower levels of percentage of population with a disability under the age of 5 due to other factors.
Demographics Similar to Immigrants from Moldova by Disability Age Under 5
In terms of disability age under 5, the demographic groups most similar to Immigrants from Moldova are Sri Lankan (1.1%, a difference of 0.050%), Mongolian (1.1%, a difference of 0.10%), Spanish American (1.1%, a difference of 0.11%), Immigrants from Cuba (1.1%, a difference of 0.14%), and Immigrants from Iraq (1.1%, a difference of 0.20%).
| Demographics | Rating | Rank | Disability Age Under 5 |
| Immigrants from Dominican Republic | 97.5 /100 | #88 | Exceptional 1.1% |
| Ethiopians | 97.2 /100 | #89 | Exceptional 1.1% |
| Chinese | 97.2 /100 | #90 | Exceptional 1.1% |
| Albanians | 97.2 /100 | #91 | Exceptional 1.1% |
| Immigrants from Cuba | 97.0 /100 | #92 | Exceptional 1.1% |
| Spanish Americans | 96.9 /100 | #93 | Exceptional 1.1% |
| Sri Lankans | 96.8 /100 | #94 | Exceptional 1.1% |
| Immigrants from Moldova | 96.8 /100 | #95 | Exceptional 1.1% |
| Mongolians | 96.6 /100 | #96 | Exceptional 1.1% |
| Immigrants from Iraq | 96.5 /100 | #97 | Exceptional 1.1% |
| Immigrants from South Eastern Asia | 96.5 /100 | #98 | Exceptional 1.1% |
| Dominicans | 96.3 /100 | #99 | Exceptional 1.1% |
| Nicaraguans | 96.3 /100 | #100 | Exceptional 1.1% |
| Immigrants from Uganda | 96.1 /100 | #101 | Exceptional 1.1% |
| Immigrants from Morocco | 96.0 /100 | #102 | Exceptional 1.2% |
Immigrants from Moldova Disability Age Under 5 Correlation Summary
| Measurement | Immigrants from Moldova Data | Disability Age Under 5 Data |
| Minimum | 0.024% | 0.14% |
| Maximum | 1.7% | 3.7% |
| Range | 1.7% | 3.6% |
| Mean | 0.77% | 1.4% |
| Median | 0.73% | 1.3% |
| Interquartile 25% (IQ1) | 0.34% | 1.1% |
| Interquartile 75% (IQ3) | 1.1% | 1.8% |
| Interquartile Range (IQR) | 0.77% | 0.63% |
| Standard Deviation (Sample) | 0.52% | 0.77% |
| Standard Deviation (Population) | 0.50% | 0.75% |
Correlation Details
| Immigrants from Moldova Percentile | Sample Size | Disability Age Under 5 |
[ 0.0% - 0.5% ] 0.024% | 73,925,546 | 0.80% |
[ 0.0% - 0.5% ] 0.098% | 7,903,860 | 1.1% |
[ 0.0% - 0.5% ] 0.17% | 2,680,534 | 1.4% |
[ 0.0% - 0.5% ] 0.23% | 1,470,321 | 1.4% |
[ 0.0% - 0.5% ] 0.31% | 847,324 | 1.2% |
[ 0.0% - 0.5% ] 0.37% | 365,450 | 1.3% |
[ 0.0% - 0.5% ] 0.44% | 190,614 | 2.3% |
[ 0.5% - 1.0% ] 0.52% | 268,907 | 1.4% |
[ 0.5% - 1.0% ] 0.58% | 191,133 | 1.8% |
[ 0.5% - 1.0% ] 0.66% | 228,196 | 1.3% |
[ 0.5% - 1.0% ] 0.79% | 170,102 | 0.78% |
[ 0.5% - 1.0% ] 0.84% | 79,222 | 2.1% |
[ 0.5% - 1.0% ] 0.93% | 42,458 | 1.4% |
[ 1.0% - 1.5% ] 1.01% | 23,845 | 1.2% |
[ 1.0% - 1.5% ] 1.08% | 29,613 | 0.21% |
[ 1.0% - 1.5% ] 1.14% | 83,069 | 0.14% |
[ 1.0% - 1.5% ] 1.29% | 50,699 | 1.2% |
[ 1.5% - 2.0% ] 1.54% | 124,819 | 1.7% |
[ 1.5% - 2.0% ] 1.59% | 124,519 | 1.9% |
[ 1.5% - 2.0% ] 1.74% | 16,660 | 3.7% |