Sri Lankan Disability Age Under 5

COMPARE

Sri Lankan
Race
Ancestry
AfghanAfricanAlaska NativeAlaskan AthabascanAlbanianAleutAlsatianAmericanApacheArabArapahoArgentineanArmenianAssyrian/Chaldean/SyriacAustralianAustrianBahamianBangladeshiBarbadianBasqueBelgianBelizeanBermudanBhutaneseBlackfeetBolivianBrazilianBritishBritish West IndianBulgarianBurmeseCajunCambodianCanadianCape VerdeanCarpatho RusynCelticCentral AmericanCentral American IndianCherokeeCheyenneChickasawChileanChineseChippewaChoctawColombianColvilleComancheCosta RicanCreeCreekCroatianCrowCubanCypriotCzechCzechoslovakianDanishDelawareDominicanDutchDutch West IndianEastern EuropeanEcuadorianEgyptianEnglishEstonianEthiopianEuropeanFijianFilipinoFinnishFrenchFrench American IndianFrench CanadianGermanGerman RussianGhanaianGreekGuamanian/ChamorroGuatemalanGuyaneseHaitianHmongHonduranHopiHoumaHungarianIcelanderIndian (Asian)IndonesianInupiatIranianIraqiIrishIroquoisIsraeliItalianJamaicanJapaneseJordanianKenyanKiowaKoreanLaotianLatvianLebaneseLiberianLithuanianLumbeeLuxembourgerMacedonianMalaysianMalteseMarshalleseMenomineeMexicanMexican American IndianMongolianMoroccanNative HawaiianNavajoNepaleseNew ZealanderNicaraguanNigerianNorthern EuropeanNorwegianOkinawanOsageOttawaPaiutePakistaniPalestinianPanamanianParaguayanPennsylvania GermanPeruvianPimaPolishPortuguesePotawatomiPuebloPuerto RicanPuget Sound SalishRomanianRussianSalvadoranSamoanScandinavianScotch-IrishScottishSeminoleSenegaleseSerbianShoshoneSierra LeoneanSiouxSlavicSlovakSloveneSomaliSouth AfricanSouth AmericanSouth American IndianSoviet UnionSpaniardSpanishSpanish AmericanSpanish American IndianSri LankanSubsaharan AfricanSudaneseSwedishSwissSyrianTaiwaneseThaiTlingit-HaidaTohono O'OdhamTonganTrinidadian and TobagonianTsimshianTurkishU.S. Virgin IslanderUgandanUkrainianUruguayanUteVenezuelanVietnameseWelshWest IndianYakamaYaquiYugoslavianYumanYup'ikZimbabwean
Immigration
NonimmigrantsImmigrantsAfghanistanAfricaAlbaniaArgentinaArmeniaAsiaAustraliaAustriaBahamasBangladeshBarbadosBelarusBelgiumBelizeBoliviaBosnia and HerzegovinaBrazilBulgariaBurma/MyanmarCabo VerdeCambodiaCameroonCanadaCaribbeanCentral AmericaChileChinaColombiaCongoCosta RicaCroatiaCubaCzechoslovakiaDenmarkDominicaDominican RepublicEastern AfricaEastern AsiaEastern EuropeEcuadorEgyptEl SalvadorEnglandEritreaEthiopiaEuropeFijiFranceGermanyGhanaGreeceGrenadaGuatemalaGuyanaHaitiHondurasHong KongHungaryIndiaIndonesiaIranIraqIrelandIsraelItalyJamaicaJapanJordanKazakhstanKenyaKoreaKuwaitLaosLatin AmericaLatviaLebanonLiberiaLithuaniaMalaysiaMexicoMicronesiaMiddle AfricaMoldovaMoroccoNepalNetherlandsNicaraguaNigeriaNorth AmericaNorth MacedoniaNorthern AfricaNorthern EuropeNorwayOceaniaPakistanPanamaPeruPhilippinesPolandPortugalRomaniaRussiaSaudi ArabiaScotlandSenegalSerbiaSierra LeoneSingaporeSomaliaSouth AfricaSouth AmericaSouth Central AsiaSouth Eastern AsiaSouthern EuropeSpainSri LankaSt. Vincent and the GrenadinesSudanSwedenSwitzerlandSyriaTaiwanThailandTrinidad and TobagoTurkeyUgandaUkraineUruguayUzbekistanVenezuelaVietnamWest IndiesWestern AfricaWestern AsiaWestern EuropeYemenZaireZimbabweAzores
Select to Compare
Race
Ancestry
AfghanAfricanAlaska NativeAlaskan AthabascanAlbanianAleutAlsatianAmericanApacheArabArapahoArgentineanArmenianAssyrian/Chaldean/SyriacAustralianAustrianBahamianBangladeshiBarbadianBasqueBelgianBelizeanBermudanBhutaneseBlackfeetBolivianBrazilianBritishBritish West IndianBulgarianBurmeseCajunCambodianCanadianCape VerdeanCarpatho RusynCelticCentral AmericanCentral American IndianCherokeeCheyenneChickasawChileanChineseChippewaChoctawColombianColvilleComancheCosta RicanCreeCreekCroatianCrowCubanCypriotCzechCzechoslovakianDanishDelawareDominicanDutchDutch West IndianEastern EuropeanEcuadorianEgyptianEnglishEstonianEthiopianEuropeanFijianFilipinoFinnishFrenchFrench American IndianFrench CanadianGermanGerman RussianGhanaianGreekGuamanian/ChamorroGuatemalanGuyaneseHaitianHmongHonduranHopiHoumaHungarianIcelanderIndian (Asian)IndonesianInupiatIranianIraqiIrishIroquoisIsraeliItalianJamaicanJapaneseJordanianKenyanKiowaKoreanLaotianLatvianLebaneseLiberianLithuanianLumbeeLuxembourgerMacedonianMalaysianMalteseMarshalleseMenomineeMexicanMexican American IndianMongolianMoroccanNative HawaiianNavajoNepaleseNew ZealanderNicaraguanNigerianNorthern EuropeanNorwegianOkinawanOsageOttawaPaiutePakistaniPalestinianPanamanianParaguayanPennsylvania GermanPeruvianPimaPolishPortuguesePotawatomiPuebloPuerto RicanPuget Sound SalishRomanianRussianSalvadoranSamoanScandinavianScotch-IrishScottishSeminoleSenegaleseSerbianShoshoneSierra LeoneanSiouxSlavicSlovakSloveneSomaliSouth AfricanSouth AmericanSouth American IndianSoviet UnionSpaniardSpanishSpanish AmericanSpanish American IndianSubsaharan AfricanSudaneseSwedishSwissSyrianTaiwaneseThaiTlingit-HaidaTohono O'OdhamTonganTrinidadian and TobagonianTsimshianTurkishU.S. Virgin IslanderUgandanUkrainianUruguayanUteVenezuelanVietnameseWelshWest IndianYakamaYaquiYugoslavianYumanYup'ikZimbabwean
Immigration
NonimmigrantsImmigrantsAfghanistanAfricaAlbaniaArgentinaArmeniaAsiaAustraliaAustriaBahamasBangladeshBarbadosBelarusBelgiumBelizeBoliviaBosnia and HerzegovinaBrazilBulgariaBurma/MyanmarCabo VerdeCambodiaCameroonCanadaCaribbeanCentral AmericaChileChinaColombiaCongoCosta RicaCroatiaCubaCzechoslovakiaDenmarkDominicaDominican RepublicEastern AfricaEastern AsiaEastern EuropeEcuadorEgyptEl SalvadorEnglandEritreaEthiopiaEuropeFijiFranceGermanyGhanaGreeceGrenadaGuatemalaGuyanaHaitiHondurasHong KongHungaryIndiaIndonesiaIranIraqIrelandIsraelItalyJamaicaJapanJordanKazakhstanKenyaKoreaKuwaitLaosLatin AmericaLatviaLebanonLiberiaLithuaniaMalaysiaMexicoMicronesiaMiddle AfricaMoldovaMoroccoNepalNetherlandsNicaraguaNigeriaNorth AmericaNorth MacedoniaNorthern AfricaNorthern EuropeNorwayOceaniaPakistanPanamaPeruPhilippinesPolandPortugalRomaniaRussiaSaudi ArabiaScotlandSenegalSerbiaSierra LeoneSingaporeSomaliaSouth AfricaSouth AmericaSouth Central AsiaSouth Eastern AsiaSouthern EuropeSpainSri LankaSt. Vincent and the GrenadinesSudanSwedenSwitzerlandSyriaTaiwanThailandTrinidad and TobagoTurkeyUgandaUkraineUruguayUzbekistanVenezuelaVietnamWest IndiesWestern AfricaWestern AsiaWestern EuropeYemenZaireZimbabweAzores
Disability Age Under 5
Income
Poverty
Unemployment
Labor Participation
Family Structure
Vehicle Availability
Education Level
Disability

Sri Lankan Disability Age Under 5
Exceptional

1.1%
DISABILITY | AGE UNDER 5
96.8/ 100
METRIC RATING
94th/ 347
METRIC RANK

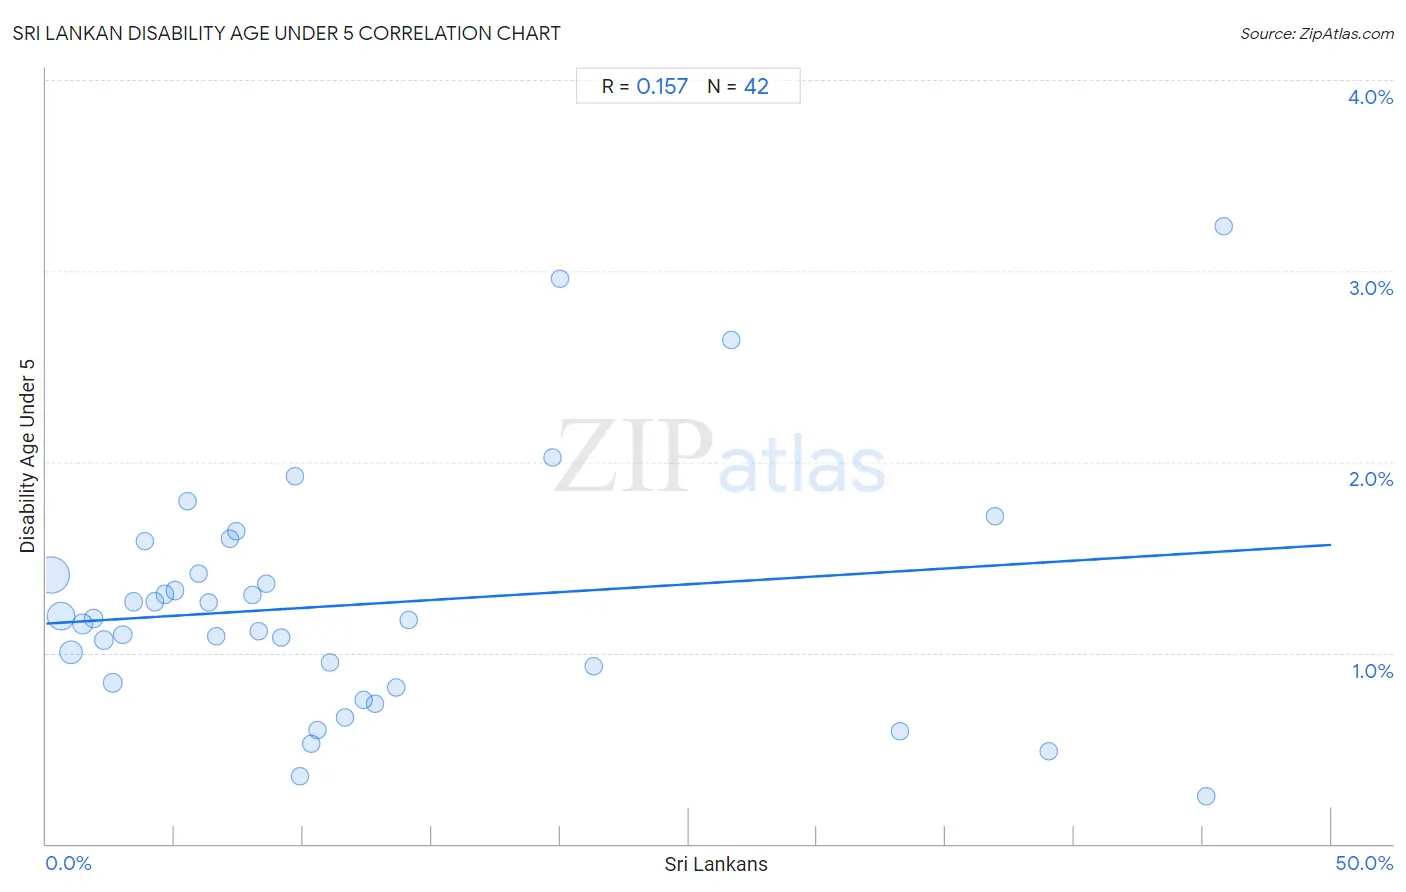
Sri Lankan Disability Age Under 5 Correlation Chart

The statistical analysis conducted on geographies consisting of 232,959,648 people shows a poor positive correlation between the proportion of Sri Lankans and percentage of population with a disability under the age of 5 in the United States with a correlation coefficient (R) of 0.157 and weighted average of 1.1%. On average, for every 1% (one percent) increase in Sri Lankans within a typical geography, there is an increase of 0.0082% in percentage of population with a disability under the age of 5.
Sri Lankan Disability Age Under 5
It is essential to understand that the correlation between the percentage of Sri Lankans and percentage of population with a disability under the age of 5 does not imply a direct cause-and-effect relationship. It remains uncertain whether the presence of Sri Lankans influences an upward or downward trend in the level of percentage of population with a disability under the age of 5 within an area, or if Sri Lankans simply ended up residing in those areas with higher or lower levels of percentage of population with a disability under the age of 5 due to other factors.

Demographics Similar to Sri Lankans by Disability Age Under 5

In terms of disability age under 5, the demographic groups most similar to Sri Lankans are Immigrants from Moldova (1.1%, a difference of 0.050%), Spanish American (1.1%, a difference of 0.060%), Immigrants from Cuba (1.1%, a difference of 0.090%), Mongolian (1.1%, a difference of 0.16%), and Albanian (1.1%, a difference of 0.26%).
DemographicsRating | RankDisability Age Under 5
Ugandans
97.5
/100
|
#87
Exceptional
1.1%
Immigrants from Dominican Republic
97.5
/100
|
#88
Exceptional
1.1%
Ethiopians
97.2
/100
|
#89
Exceptional
1.1%
Chinese
97.2
/100
|
#90
Exceptional
1.1%
Albanians
97.2
/100
|
#91
Exceptional
1.1%
Immigrants from Cuba
97.0
/100
|
#92
Exceptional
1.1%
Spanish Americans
96.9
/100
|
#93
Exceptional
1.1%
Sri Lankans
96.8
/100
|
#94
Exceptional
1.1%
Immigrants from Moldova
96.8
/100
|
#95
Exceptional
1.1%
Mongolians
96.6
/100
|
#96
Exceptional
1.1%
Immigrants from Iraq
96.5
/100
|
#97
Exceptional
1.1%
Immigrants from South Eastern Asia
96.5
/100
|
#98
Exceptional
1.1%
Dominicans
96.3
/100
|
#99
Exceptional
1.1%
Nicaraguans
96.3
/100
|
#100
Exceptional
1.1%
Immigrants from Uganda
96.1
/100
|
#101
Exceptional
1.1%

Sri Lankan Disability Age Under 5 Correlation Summary

MeasurementSri Lankan DataDisability Age Under 5 Data
Minimum0.19%0.25%
Maximum45.8%3.2%
Range45.6%3.0%
Mean12.2%1.3%
Median8.4%1.2%
Interquartile 25% (IQ1)4.2%0.84%
Interquartile 75% (IQ3)13.6%1.4%
Interquartile Range (IQR)9.4%0.57%
Standard Deviation (Sample)12.0%0.63%
Standard Deviation (Population)11.9%0.62%

Correlation Details

Sri Lankan PercentileSample SizeDisability Age Under 5
[
0.0%
-
0.5%
]
0.19%
101,573,7651.4%
[
0.5%
-
1.0%
]
0.57%
55,759,4931.2%
[
0.5%
-
1.0%
]
0.97%
29,406,7391.0%
[
1.0%
-
1.5%
]
1.41%
11,125,9711.1%
[
1.5%
-
2.0%
]
1.83%
9,434,9981.2%
[
2.0%
-
2.5%
]
2.24%
5,736,1641.1%
[
2.5%
-
3.0%
]
2.59%
3,903,5570.84%
[
2.5%
-
3.0%
]
2.97%
3,951,0131.1%
[
3.0%
-
3.5%
]
3.41%
1,558,4131.3%
[
3.5%
-
4.0%
]
3.85%
1,364,5651.6%
[
4.0%
-
4.5%
]
4.23%
1,191,6551.3%
[
4.5%
-
5.0%
]
4.62%
633,5601.3%
[
5.0%
-
5.5%
]
5.03%
900,8881.3%
[
5.0%
-
5.5%
]
5.48%
272,7491.8%
[
5.5%
-
6.0%
]
5.95%
1,159,5101.4%
[
6.0%
-
6.5%
]
6.33%
418,1761.3%
[
6.5%
-
7.0%
]
6.62%
276,5351.1%
[
7.0%
-
7.5%
]
7.15%
284,8351.6%
[
7.0%
-
7.5%
]
7.41%
109,6351.6%
[
8.0%
-
8.5%
]
8.03%
358,6121.3%
[
8.0%
-
8.5%
]
8.25%
206,6501.1%
[
8.5%
-
9.0%
]
8.56%
135,3181.4%
[
9.0%
-
9.5%
]
9.13%
295,8471.1%
[
9.5%
-
10.0%
]
9.66%
35,6641.9%
[
9.5%
-
10.0%
]
9.89%
133,5380.36%
[
10.0%
-
10.5%
]
10.33%
108,6820.53%
[
10.5%
-
11.0%
]
10.55%
58,7750.60%
[
11.0%
-
11.5%
]
11.05%
75,0040.95%
[
11.5%
-
12.0%
]
11.61%
120,7680.66%
[
12.0%
-
12.5%
]
12.33%
1,069,8130.75%
[
12.5%
-
13.0%
]
12.78%
112,7050.74%
[
13.5%
-
14.0%
]
13.63%
243,1850.82%
[
14.0%
-
14.5%
]
14.10%
142,3601.2%
[
19.5%
-
20.0%
]
19.68%
59,8512.0%
[
19.5%
-
20.0%
]
19.97%
55,0983.0%
[
21.0%
-
21.5%
]
21.31%
52,5550.93%
[
26.5%
-
27.0%
]
26.64%
173,2692.6%
[
33.0%
-
33.5%
]
33.20%
171,6370.59%
[
36.5%
-
37.0%
]
36.91%
36,6571.7%
[
39.0%
-
39.5%
]
39.02%
47,5490.48%
[
45.0%
-
45.5%
]
45.14%
181,2680.25%
[
45.5%
-
46.0%
]
45.82%
22,6223.2%