Immigrants from Belarus Disability Age Under 5

COMPARE

Immigrants from Belarus
Race
Ancestry
AfghanAfricanAlaska NativeAlaskan AthabascanAlbanianAleutAlsatianAmericanApacheArabArapahoArgentineanArmenianAssyrian/Chaldean/SyriacAustralianAustrianBahamianBangladeshiBarbadianBasqueBelgianBelizeanBermudanBhutaneseBlackfeetBolivianBrazilianBritishBritish West IndianBulgarianBurmeseCajunCambodianCanadianCape VerdeanCarpatho RusynCelticCentral AmericanCentral American IndianCherokeeCheyenneChickasawChileanChineseChippewaChoctawColombianColvilleComancheCosta RicanCreeCreekCroatianCrowCubanCypriotCzechCzechoslovakianDanishDelawareDominicanDutchDutch West IndianEastern EuropeanEcuadorianEgyptianEnglishEstonianEthiopianEuropeanFijianFilipinoFinnishFrenchFrench American IndianFrench CanadianGermanGerman RussianGhanaianGreekGuamanian/ChamorroGuatemalanGuyaneseHaitianHmongHonduranHopiHoumaHungarianIcelanderIndian (Asian)IndonesianInupiatIranianIraqiIrishIroquoisIsraeliItalianJamaicanJapaneseJordanianKenyanKiowaKoreanLaotianLatvianLebaneseLiberianLithuanianLumbeeLuxembourgerMacedonianMalaysianMalteseMarshalleseMenomineeMexicanMexican American IndianMongolianMoroccanNative HawaiianNavajoNepaleseNew ZealanderNicaraguanNigerianNorthern EuropeanNorwegianOkinawanOsageOttawaPaiutePakistaniPalestinianPanamanianParaguayanPennsylvania GermanPeruvianPimaPolishPortuguesePotawatomiPuebloPuerto RicanPuget Sound SalishRomanianRussianSalvadoranSamoanScandinavianScotch-IrishScottishSeminoleSenegaleseSerbianShoshoneSierra LeoneanSiouxSlavicSlovakSloveneSomaliSouth AfricanSouth AmericanSouth American IndianSoviet UnionSpaniardSpanishSpanish AmericanSpanish American IndianSri LankanSubsaharan AfricanSudaneseSwedishSwissSyrianTaiwaneseThaiTlingit-HaidaTohono O'OdhamTonganTrinidadian and TobagonianTsimshianTurkishU.S. Virgin IslanderUgandanUkrainianUruguayanUteVenezuelanVietnameseWelshWest IndianYakamaYaquiYugoslavianYumanYup'ikZimbabwean
Immigration
NonimmigrantsImmigrantsAfghanistanAfricaAlbaniaArgentinaArmeniaAsiaAustraliaAustriaBahamasBangladeshBarbadosBelarusBelgiumBelizeBoliviaBosnia and HerzegovinaBrazilBulgariaBurma/MyanmarCabo VerdeCambodiaCameroonCanadaCaribbeanCentral AmericaChileChinaColombiaCongoCosta RicaCroatiaCubaCzechoslovakiaDenmarkDominicaDominican RepublicEastern AfricaEastern AsiaEastern EuropeEcuadorEgyptEl SalvadorEnglandEritreaEthiopiaEuropeFijiFranceGermanyGhanaGreeceGrenadaGuatemalaGuyanaHaitiHondurasHong KongHungaryIndiaIndonesiaIranIraqIrelandIsraelItalyJamaicaJapanJordanKazakhstanKenyaKoreaKuwaitLaosLatin AmericaLatviaLebanonLiberiaLithuaniaMalaysiaMexicoMicronesiaMiddle AfricaMoldovaMoroccoNepalNetherlandsNicaraguaNigeriaNorth AmericaNorth MacedoniaNorthern AfricaNorthern EuropeNorwayOceaniaPakistanPanamaPeruPhilippinesPolandPortugalRomaniaRussiaSaudi ArabiaScotlandSenegalSerbiaSierra LeoneSingaporeSomaliaSouth AfricaSouth AmericaSouth Central AsiaSouth Eastern AsiaSouthern EuropeSpainSri LankaSt. Vincent and the GrenadinesSudanSwedenSwitzerlandSyriaTaiwanThailandTrinidad and TobagoTurkeyUgandaUkraineUruguayUzbekistanVenezuelaVietnamWest IndiesWestern AfricaWestern AsiaWestern EuropeYemenZaireZimbabweAzores
Select to Compare
Race
Ancestry
AfghanAfricanAlaska NativeAlaskan AthabascanAlbanianAleutAlsatianAmericanApacheArabArapahoArgentineanArmenianAssyrian/Chaldean/SyriacAustralianAustrianBahamianBangladeshiBarbadianBasqueBelgianBelizeanBermudanBhutaneseBlackfeetBolivianBrazilianBritishBritish West IndianBulgarianBurmeseCajunCambodianCanadianCape VerdeanCarpatho RusynCelticCentral AmericanCentral American IndianCherokeeCheyenneChickasawChileanChineseChippewaChoctawColombianColvilleComancheCosta RicanCreeCreekCroatianCrowCubanCypriotCzechCzechoslovakianDanishDelawareDominicanDutchDutch West IndianEastern EuropeanEcuadorianEgyptianEnglishEstonianEthiopianEuropeanFijianFilipinoFinnishFrenchFrench American IndianFrench CanadianGermanGerman RussianGhanaianGreekGuamanian/ChamorroGuatemalanGuyaneseHaitianHmongHonduranHopiHoumaHungarianIcelanderIndian (Asian)IndonesianInupiatIranianIraqiIrishIroquoisIsraeliItalianJamaicanJapaneseJordanianKenyanKiowaKoreanLaotianLatvianLebaneseLiberianLithuanianLumbeeLuxembourgerMacedonianMalaysianMalteseMarshalleseMenomineeMexicanMexican American IndianMongolianMoroccanNative HawaiianNavajoNepaleseNew ZealanderNicaraguanNigerianNorthern EuropeanNorwegianOkinawanOsageOttawaPaiutePakistaniPalestinianPanamanianParaguayanPennsylvania GermanPeruvianPimaPolishPortuguesePotawatomiPuebloPuerto RicanPuget Sound SalishRomanianRussianSalvadoranSamoanScandinavianScotch-IrishScottishSeminoleSenegaleseSerbianShoshoneSierra LeoneanSiouxSlavicSlovakSloveneSomaliSouth AfricanSouth AmericanSouth American IndianSoviet UnionSpaniardSpanishSpanish AmericanSpanish American IndianSri LankanSubsaharan AfricanSudaneseSwedishSwissSyrianTaiwaneseThaiTlingit-HaidaTohono O'OdhamTonganTrinidadian and TobagonianTsimshianTurkishU.S. Virgin IslanderUgandanUkrainianUruguayanUteVenezuelanVietnameseWelshWest IndianYakamaYaquiYugoslavianYumanYup'ikZimbabwean
Immigration
NonimmigrantsImmigrantsAfghanistanAfricaAlbaniaArgentinaArmeniaAsiaAustraliaAustriaBahamasBangladeshBarbadosBelgiumBelizeBoliviaBosnia and HerzegovinaBrazilBulgariaBurma/MyanmarCabo VerdeCambodiaCameroonCanadaCaribbeanCentral AmericaChileChinaColombiaCongoCosta RicaCroatiaCubaCzechoslovakiaDenmarkDominicaDominican RepublicEastern AfricaEastern AsiaEastern EuropeEcuadorEgyptEl SalvadorEnglandEritreaEthiopiaEuropeFijiFranceGermanyGhanaGreeceGrenadaGuatemalaGuyanaHaitiHondurasHong KongHungaryIndiaIndonesiaIranIraqIrelandIsraelItalyJamaicaJapanJordanKazakhstanKenyaKoreaKuwaitLaosLatin AmericaLatviaLebanonLiberiaLithuaniaMalaysiaMexicoMicronesiaMiddle AfricaMoldovaMoroccoNepalNetherlandsNicaraguaNigeriaNorth AmericaNorth MacedoniaNorthern AfricaNorthern EuropeNorwayOceaniaPakistanPanamaPeruPhilippinesPolandPortugalRomaniaRussiaSaudi ArabiaScotlandSenegalSerbiaSierra LeoneSingaporeSomaliaSouth AfricaSouth AmericaSouth Central AsiaSouth Eastern AsiaSouthern EuropeSpainSri LankaSt. Vincent and the GrenadinesSudanSwedenSwitzerlandSyriaTaiwanThailandTrinidad and TobagoTurkeyUgandaUkraineUruguayUzbekistanVenezuelaVietnamWest IndiesWestern AfricaWestern AsiaWestern EuropeYemenZaireZimbabweAzores
Disability Age Under 5
Income
Poverty
Unemployment
Labor Participation
Family Structure
Vehicle Availability
Education Level
Disability

Immigrants from Belarus Disability Age Under 5
Exceptional

1.0%
DISABILITY | AGE UNDER 5
100.0/ 100
METRIC RATING
29th/ 347
METRIC RANK

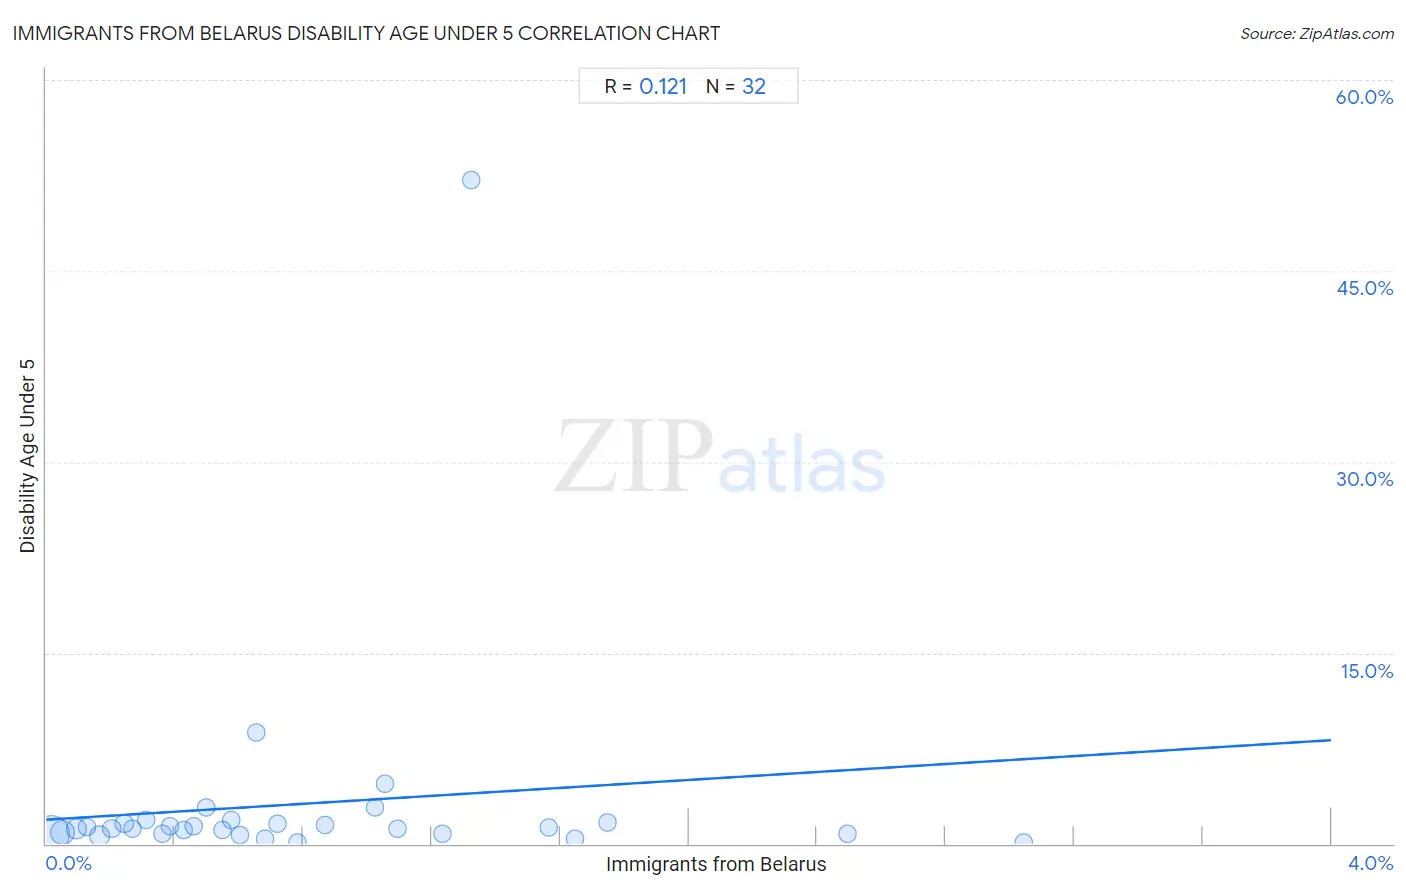
Immigrants from Belarus Disability Age Under 5 Correlation Chart

The statistical analysis conducted on geographies consisting of 102,408,276 people shows a poor positive correlation between the proportion of Immigrants from Belarus and percentage of population with a disability under the age of 5 in the United States with a correlation coefficient (R) of 0.121 and weighted average of 1.0%. On average, for every 1% (one percent) increase in Immigrants from Belarus within a typical geography, there is an increase of 1.6% in percentage of population with a disability under the age of 5.
Immigrants from Belarus Disability Age Under 5
It is essential to understand that the correlation between the percentage of Immigrants from Belarus and percentage of population with a disability under the age of 5 does not imply a direct cause-and-effect relationship. It remains uncertain whether the presence of Immigrants from Belarus influences an upward or downward trend in the level of percentage of population with a disability under the age of 5 within an area, or if Immigrants from Belarus simply ended up residing in those areas with higher or lower levels of percentage of population with a disability under the age of 5 due to other factors.

Demographics Similar to Immigrants from Belarus by Disability Age Under 5

In terms of disability age under 5, the demographic groups most similar to Immigrants from Belarus are Immigrants from Eastern Asia (1.0%, a difference of 0.12%), Immigrants from South Central Asia (1.0%, a difference of 0.52%), Guyanese (1.0%, a difference of 0.76%), Armenian (1.0%, a difference of 0.81%), and Iranian (1.0%, a difference of 0.86%).
DemographicsRating | RankDisability Age Under 5
Immigrants from Iran
100.0
/100
|
#22
Exceptional
1.00%
Yakama
100.0
/100
|
#23
Exceptional
1.00%
Indians (Asian)
100.0
/100
|
#24
Exceptional
1.0%
Immigrants from Micronesia
100.0
/100
|
#25
Exceptional
1.0%
Immigrants from Taiwan
100.0
/100
|
#26
Exceptional
1.0%
Guyanese
100.0
/100
|
#27
Exceptional
1.0%
Immigrants from Eastern Asia
100.0
/100
|
#28
Exceptional
1.0%
Immigrants from Belarus
100.0
/100
|
#29
Exceptional
1.0%
Immigrants from South Central Asia
99.9
/100
|
#30
Exceptional
1.0%
Armenians
99.9
/100
|
#31
Exceptional
1.0%
Iranians
99.9
/100
|
#32
Exceptional
1.0%
Bolivians
99.9
/100
|
#33
Exceptional
1.0%
Immigrants from Ukraine
99.9
/100
|
#34
Exceptional
1.0%
Barbadians
99.9
/100
|
#35
Exceptional
1.0%
Immigrants from Nepal
99.9
/100
|
#36
Exceptional
1.0%

Immigrants from Belarus Disability Age Under 5 Correlation Summary

MeasurementImmigrants from Belarus DataDisability Age Under 5 Data
Minimum0.015%0.12%
Maximum3.0%52.1%
Range3.0%52.0%
Mean0.79%3.1%
Median0.59%1.2%
Interquartile 25% (IQ1)0.29%0.78%
Interquartile 75% (IQ3)1.1%1.6%
Interquartile Range (IQR)0.78%0.83%
Standard Deviation (Sample)0.70%9.1%
Standard Deviation (Population)0.69%8.9%

Correlation Details

Immigrants from Belarus PercentileSample SizeDisability Age Under 5
[
0.0%
-
0.5%
]
0.015%
58,412,9190.82%
[
0.0%
-
0.5%
]
0.050%
19,519,3530.88%
[
0.0%
-
0.5%
]
0.093%
6,556,2861.1%
[
0.0%
-
0.5%
]
0.13%
3,071,5761.3%
[
0.0%
-
0.5%
]
0.17%
10,147,6520.63%
[
0.0%
-
0.5%
]
0.20%
783,3151.2%
[
0.0%
-
0.5%
]
0.24%
551,8851.5%
[
0.0%
-
0.5%
]
0.27%
632,2641.2%
[
0.0%
-
0.5%
]
0.31%
482,7601.9%
[
0.0%
-
0.5%
]
0.36%
262,7970.77%
[
0.0%
-
0.5%
]
0.38%
266,0211.4%
[
0.0%
-
0.5%
]
0.43%
241,8291.1%
[
0.0%
-
0.5%
]
0.46%
286,4421.4%
[
0.0%
-
0.5%
]
0.50%
105,4992.8%
[
0.5%
-
1.0%
]
0.55%
192,6001.1%
[
0.5%
-
1.0%
]
0.57%
160,3841.9%
[
0.5%
-
1.0%
]
0.60%
42,8110.72%
[
0.5%
-
1.0%
]
0.66%
8,3908.8%
[
0.5%
-
1.0%
]
0.68%
37,6350.39%
[
0.5%
-
1.0%
]
0.72%
160,4301.6%
[
0.5%
-
1.0%
]
0.78%
76,7940.12%
[
0.5%
-
1.0%
]
0.87%
63,2921.4%
[
1.0%
-
1.5%
]
1.02%
21,0992.8%
[
1.0%
-
1.5%
]
1.05%
4,5554.7%
[
1.0%
-
1.5%
]
1.09%
36,3391.2%
[
1.0%
-
1.5%
]
1.23%
34,0150.75%
[
1.0%
-
1.5%
]
1.32%
7,10452.1%
[
1.5%
-
2.0%
]
1.56%
7,4791.3%
[
1.5%
-
2.0%
]
1.65%
80,1130.44%
[
1.5%
-
2.0%
]
1.75%
23,6761.7%
[
2.0%
-
2.5%
]
2.50%
47,8930.79%
[
3.0%
-
3.5%
]
3.04%
83,0690.14%