Okinawan Disability Age Under 5
COMPARE
Okinawan
Select to Compare
Disability Age Under 5
Okinawan Disability Age Under 5
1.1%
DISABILITY | AGE UNDER 5
97.6/ 100
METRIC RATING
86th/ 347
METRIC RANK
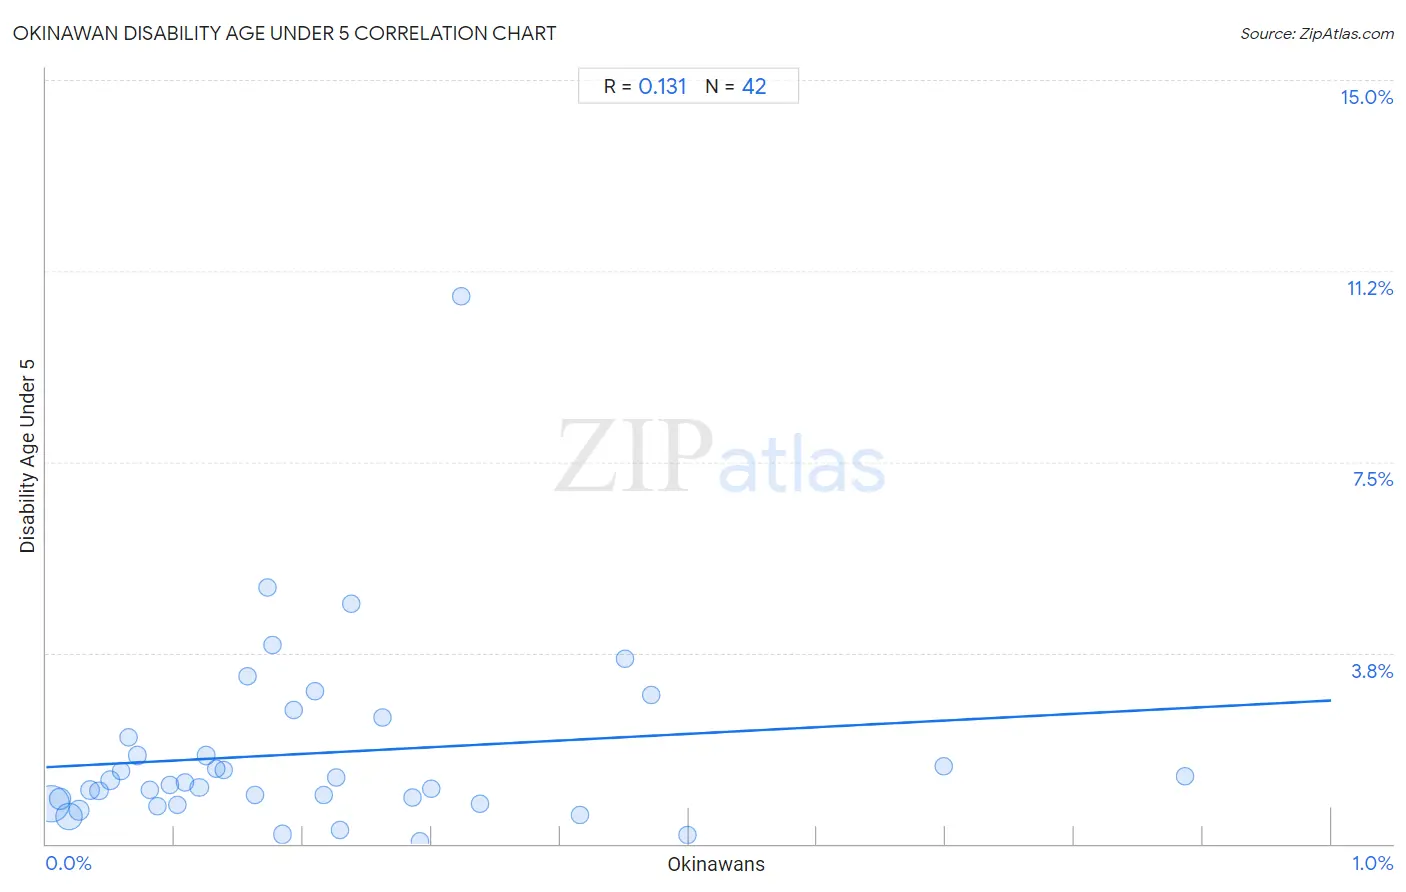
Okinawan Disability Age Under 5 Correlation Chart
The statistical analysis conducted on geographies consisting of 59,482,262 people shows a poor positive correlation between the proportion of Okinawans and percentage of population with a disability under the age of 5 in the United States with a correlation coefficient (R) of 0.131 and weighted average of 1.1%. On average, for every 1% (one percent) increase in Okinawans within a typical geography, there is an increase of 1.3% in percentage of population with a disability under the age of 5.
It is essential to understand that the correlation between the percentage of Okinawans and percentage of population with a disability under the age of 5 does not imply a direct cause-and-effect relationship. It remains uncertain whether the presence of Okinawans influences an upward or downward trend in the level of percentage of population with a disability under the age of 5 within an area, or if Okinawans simply ended up residing in those areas with higher or lower levels of percentage of population with a disability under the age of 5 due to other factors.
Demographics Similar to Okinawans by Disability Age Under 5
In terms of disability age under 5, the demographic groups most similar to Okinawans are Ugandan (1.1%, a difference of 0.020%), Immigrants from Dominican Republic (1.1%, a difference of 0.040%), Sudanese (1.1%, a difference of 0.13%), Immigrants from Zaire (1.1%, a difference of 0.20%), and Ethiopian (1.1%, a difference of 0.32%).
| Demographics | Rating | Rank | Disability Age Under 5 |
| Hmong | 98.0 /100 | #79 | Exceptional 1.1% |
| Immigrants from Trinidad and Tobago | 98.0 /100 | #80 | Exceptional 1.1% |
| Turks | 98.0 /100 | #81 | Exceptional 1.1% |
| Immigrants from Jordan | 97.9 /100 | #82 | Exceptional 1.1% |
| Immigrants from Syria | 97.9 /100 | #83 | Exceptional 1.1% |
| Immigrants from Zaire | 97.8 /100 | #84 | Exceptional 1.1% |
| Sudanese | 97.7 /100 | #85 | Exceptional 1.1% |
| Okinawans | 97.6 /100 | #86 | Exceptional 1.1% |
| Ugandans | 97.5 /100 | #87 | Exceptional 1.1% |
| Immigrants from Dominican Republic | 97.5 /100 | #88 | Exceptional 1.1% |
| Ethiopians | 97.2 /100 | #89 | Exceptional 1.1% |
| Chinese | 97.2 /100 | #90 | Exceptional 1.1% |
| Albanians | 97.2 /100 | #91 | Exceptional 1.1% |
| Immigrants from Cuba | 97.0 /100 | #92 | Exceptional 1.1% |
| Spanish Americans | 96.9 /100 | #93 | Exceptional 1.1% |
Okinawan Disability Age Under 5 Correlation Summary
| Measurement | Okinawan Data | Disability Age Under 5 Data |
| Minimum | 0.0039% | 0.058% |
| Maximum | 0.89% | 10.8% |
| Range | 0.88% | 10.7% |
| Mean | 0.21% | 1.8% |
| Median | 0.17% | 1.2% |
| Interquartile 25% (IQ1) | 0.080% | 0.80% |
| Interquartile 75% (IQ3) | 0.28% | 2.1% |
| Interquartile Range (IQR) | 0.20% | 1.3% |
| Standard Deviation (Sample) | 0.19% | 1.8% |
| Standard Deviation (Population) | 0.18% | 1.8% |
Correlation Details
| Okinawan Percentile | Sample Size | Disability Age Under 5 |
[ 0.0% - 0.5% ] 0.0039% | 29,078,886 | 0.78% |
[ 0.0% - 0.5% ] 0.010% | 5,614,892 | 0.88% |
[ 0.0% - 0.5% ] 0.018% | 12,771,104 | 0.53% |
[ 0.0% - 0.5% ] 0.025% | 3,124,345 | 0.66% |
[ 0.0% - 0.5% ] 0.034% | 1,678,510 | 1.1% |
[ 0.0% - 0.5% ] 0.041% | 1,189,346 | 1.0% |
[ 0.0% - 0.5% ] 0.050% | 1,235,717 | 1.2% |
[ 0.0% - 0.5% ] 0.058% | 655,951 | 1.4% |
[ 0.0% - 0.5% ] 0.064% | 579,914 | 2.1% |
[ 0.0% - 0.5% ] 0.071% | 411,020 | 1.7% |
[ 0.0% - 0.5% ] 0.080% | 539,435 | 1.1% |
[ 0.0% - 0.5% ] 0.086% | 194,626 | 0.74% |
[ 0.0% - 0.5% ] 0.096% | 240,799 | 1.2% |
[ 0.0% - 0.5% ] 0.10% | 416,765 | 0.77% |
[ 0.0% - 0.5% ] 0.11% | 157,463 | 1.2% |
[ 0.0% - 0.5% ] 0.12% | 227,478 | 1.1% |
[ 0.0% - 0.5% ] 0.12% | 326,735 | 1.7% |
[ 0.0% - 0.5% ] 0.13% | 98,890 | 1.5% |
[ 0.0% - 0.5% ] 0.14% | 43,458 | 1.5% |
[ 0.0% - 0.5% ] 0.16% | 28,754 | 3.3% |
[ 0.0% - 0.5% ] 0.16% | 103,872 | 0.95% |
[ 0.0% - 0.5% ] 0.17% | 41,912 | 5.0% |
[ 0.0% - 0.5% ] 0.18% | 7,382 | 3.9% |
[ 0.0% - 0.5% ] 0.18% | 44,575 | 0.18% |
[ 0.0% - 0.5% ] 0.19% | 42,504 | 2.6% |
[ 0.0% - 0.5% ] 0.21% | 135,172 | 3.0% |
[ 0.0% - 0.5% ] 0.22% | 27,785 | 0.95% |
[ 0.0% - 0.5% ] 0.23% | 31,026 | 1.3% |
[ 0.0% - 0.5% ] 0.23% | 45,531 | 0.26% |
[ 0.0% - 0.5% ] 0.24% | 16,026 | 4.7% |
[ 0.0% - 0.5% ] 0.26% | 32,451 | 2.5% |
[ 0.0% - 0.5% ] 0.28% | 30,196 | 0.92% |
[ 0.0% - 0.5% ] 0.29% | 29,544 | 0.058% |
[ 0.0% - 0.5% ] 0.30% | 21,726 | 1.1% |
[ 0.0% - 0.5% ] 0.32% | 15,173 | 10.8% |
[ 0.0% - 0.5% ] 0.34% | 56,263 | 0.80% |
[ 0.0% - 0.5% ] 0.42% | 94,355 | 0.57% |
[ 0.0% - 0.5% ] 0.45% | 29,080 | 3.6% |
[ 0.0% - 0.5% ] 0.47% | 6,368 | 2.9% |
[ 0.0% - 0.5% ] 0.50% | 8,815 | 0.17% |
[ 0.5% - 1.0% ] 0.70% | 27,212 | 1.5% |
[ 0.5% - 1.0% ] 0.89% | 21,206 | 1.3% |