Salvadoran Disability Age Under 5
COMPARE
Salvadoran
Select to Compare
Disability Age Under 5
Salvadoran Disability Age Under 5
1.1%
DISABILITY | AGE UNDER 5
99.5/ 100
METRIC RATING
55th/ 347
METRIC RANK
Salvadoran Disability Age Under 5 Correlation Chart
The statistical analysis conducted on geographies consisting of 220,785,812 people shows a weak negative correlation between the proportion of Salvadorans and percentage of population with a disability under the age of 5 in the United States with a correlation coefficient (R) of -0.243 and weighted average of 1.1%. On average, for every 1% (one percent) increase in Salvadorans within a typical geography, there is a decrease of 0.020% in percentage of population with a disability under the age of 5.
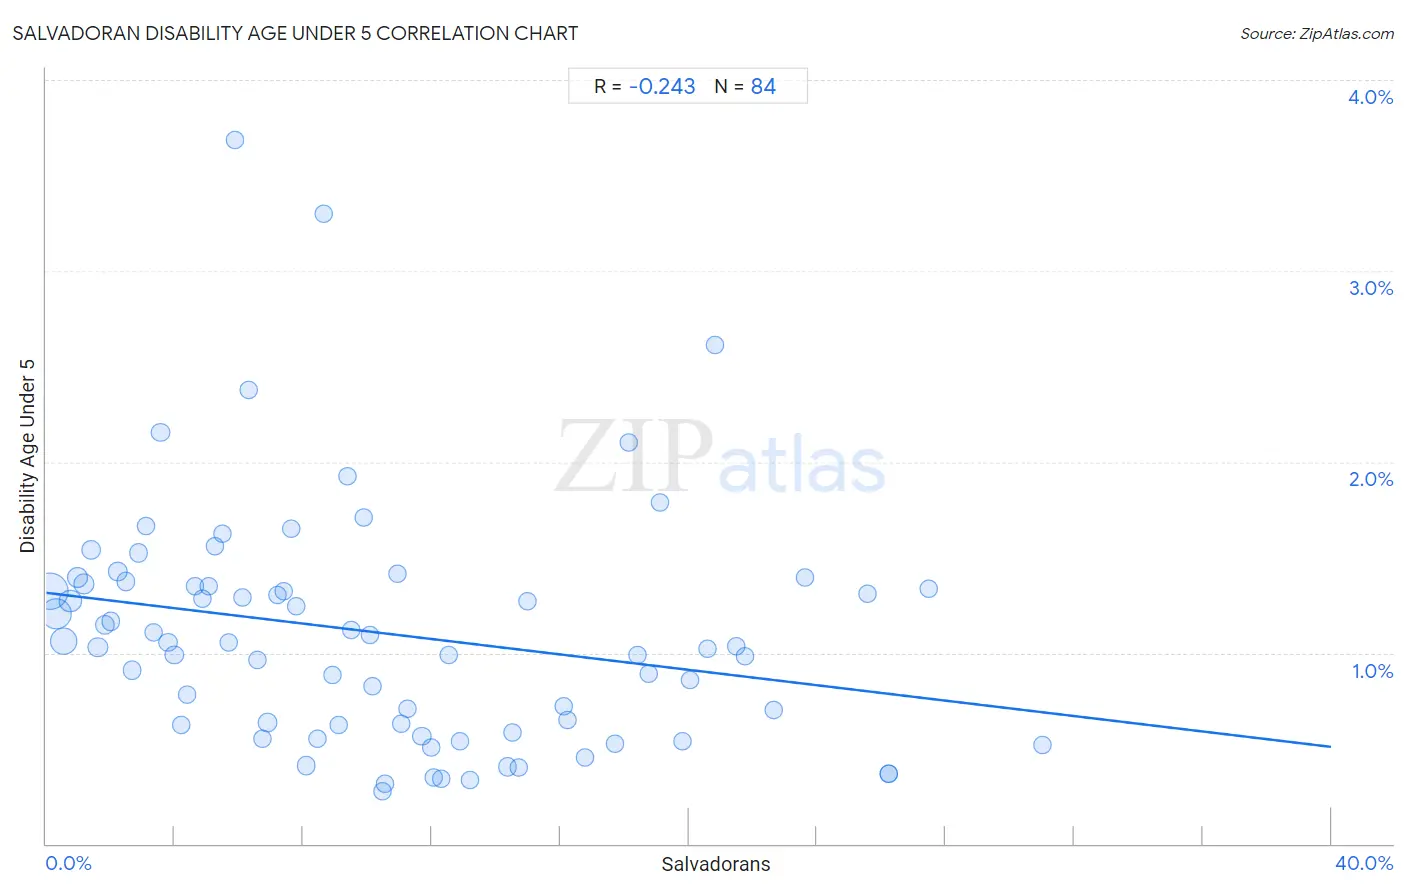
It is essential to understand that the correlation between the percentage of Salvadorans and percentage of population with a disability under the age of 5 does not imply a direct cause-and-effect relationship. It remains uncertain whether the presence of Salvadorans influences an upward or downward trend in the level of percentage of population with a disability under the age of 5 within an area, or if Salvadorans simply ended up residing in those areas with higher or lower levels of percentage of population with a disability under the age of 5 due to other factors.
Demographics Similar to Salvadorans by Disability Age Under 5
In terms of disability age under 5, the demographic groups most similar to Salvadorans are Immigrants from El Salvador (1.1%, a difference of 0.090%), Asian (1.1%, a difference of 0.38%), Ecuadorian (1.1%, a difference of 0.39%), Assyrian/Chaldean/Syriac (1.1%, a difference of 0.42%), and Immigrants from Egypt (1.1%, a difference of 0.61%).
| Demographics | Rating | Rank | Disability Age Under 5 |
| Immigrants from Singapore | 99.7 /100 | #48 | Exceptional 1.1% |
| Immigrants from Russia | 99.7 /100 | #49 | Exceptional 1.1% |
| Immigrants from Japan | 99.7 /100 | #50 | Exceptional 1.1% |
| Immigrants from Kazakhstan | 99.7 /100 | #51 | Exceptional 1.1% |
| Immigrants from Bolivia | 99.6 /100 | #52 | Exceptional 1.1% |
| Asians | 99.6 /100 | #53 | Exceptional 1.1% |
| Immigrants from El Salvador | 99.6 /100 | #54 | Exceptional 1.1% |
| Salvadorans | 99.5 /100 | #55 | Exceptional 1.1% |
| Ecuadorians | 99.5 /100 | #56 | Exceptional 1.1% |
| Assyrians/Chaldeans/Syriacs | 99.5 /100 | #57 | Exceptional 1.1% |
| Immigrants from Egypt | 99.4 /100 | #58 | Exceptional 1.1% |
| Immigrants from Malaysia | 99.4 /100 | #59 | Exceptional 1.1% |
| Immigrants from Western Asia | 99.2 /100 | #60 | Exceptional 1.1% |
| Immigrants from Ethiopia | 99.2 /100 | #61 | Exceptional 1.1% |
| Immigrants from Switzerland | 99.2 /100 | #62 | Exceptional 1.1% |
Salvadoran Disability Age Under 5 Correlation Summary
| Measurement | Salvadoran Data | Disability Age Under 5 Data |
| Minimum | 0.10% | 0.27% |
| Maximum | 31.0% | 3.7% |
| Range | 30.9% | 3.4% |
| Mean | 10.6% | 1.1% |
| Median | 9.2% | 1.0% |
| Interquartile 25% (IQ1) | 4.5% | 0.62% |
| Interquartile 75% (IQ3) | 15.5% | 1.4% |
| Interquartile Range (IQR) | 11.0% | 0.74% |
| Standard Deviation (Sample) | 7.5% | 0.63% |
| Standard Deviation (Population) | 7.5% | 0.62% |
Correlation Details
| Salvadoran Percentile | Sample Size | Disability Age Under 5 |
[ 0.0% - 0.5% ] 0.10% | 65,502,248 | 1.3% |
[ 0.0% - 0.5% ] 0.31% | 43,541,152 | 1.2% |
[ 0.5% - 1.0% ] 0.54% | 31,062,193 | 1.1% |
[ 0.5% - 1.0% ] 0.75% | 14,971,455 | 1.3% |
[ 0.5% - 1.0% ] 0.97% | 8,839,301 | 1.4% |
[ 1.0% - 1.5% ] 1.17% | 7,701,302 | 1.4% |
[ 1.0% - 1.5% ] 1.40% | 5,064,641 | 1.5% |
[ 1.5% - 2.0% ] 1.61% | 6,141,940 | 1.0% |
[ 1.5% - 2.0% ] 1.82% | 5,283,059 | 1.1% |
[ 2.0% - 2.5% ] 2.01% | 3,522,051 | 1.2% |
[ 2.0% - 2.5% ] 2.23% | 2,475,011 | 1.4% |
[ 2.0% - 2.5% ] 2.48% | 2,618,023 | 1.4% |
[ 2.5% - 3.0% ] 2.67% | 2,696,005 | 0.91% |
[ 2.5% - 3.0% ] 2.88% | 1,459,519 | 1.5% |
[ 3.0% - 3.5% ] 3.12% | 1,645,047 | 1.7% |
[ 3.0% - 3.5% ] 3.35% | 1,033,068 | 1.1% |
[ 3.5% - 4.0% ] 3.55% | 771,148 | 2.2% |
[ 3.5% - 4.0% ] 3.79% | 766,940 | 1.1% |
[ 3.5% - 4.0% ] 3.99% | 546,023 | 0.99% |
[ 4.0% - 4.5% ] 4.19% | 347,887 | 0.62% |
[ 4.0% - 4.5% ] 4.39% | 2,628,586 | 0.78% |
[ 4.5% - 5.0% ] 4.62% | 350,528 | 1.3% |
[ 4.5% - 5.0% ] 4.85% | 418,516 | 1.3% |
[ 5.0% - 5.5% ] 5.06% | 274,428 | 1.3% |
[ 5.0% - 5.5% ] 5.26% | 409,514 | 1.6% |
[ 5.0% - 5.5% ] 5.49% | 340,551 | 1.6% |
[ 5.5% - 6.0% ] 5.70% | 244,160 | 1.1% |
[ 5.5% - 6.0% ] 5.88% | 102,490 | 3.7% |
[ 6.0% - 6.5% ] 6.09% | 480,041 | 1.3% |
[ 6.0% - 6.5% ] 6.32% | 287,618 | 2.4% |
[ 6.5% - 7.0% ] 6.56% | 321,385 | 0.96% |
[ 6.5% - 7.0% ] 6.74% | 195,173 | 0.55% |
[ 6.5% - 7.0% ] 6.89% | 4,130,652 | 0.63% |
[ 7.0% - 7.5% ] 7.18% | 256,346 | 1.3% |
[ 7.0% - 7.5% ] 7.41% | 186,269 | 1.3% |
[ 7.5% - 8.0% ] 7.63% | 264,025 | 1.6% |
[ 7.5% - 8.0% ] 7.79% | 204,542 | 1.2% |
[ 8.0% - 8.5% ] 8.09% | 314,128 | 0.41% |
[ 8.0% - 8.5% ] 8.44% | 195,130 | 0.55% |
[ 8.5% - 9.0% ] 8.62% | 28,754 | 3.3% |
[ 8.5% - 9.0% ] 8.90% | 22,657 | 0.88% |
[ 9.0% - 9.5% ] 9.12% | 318,094 | 0.62% |
[ 9.0% - 9.5% ] 9.37% | 140,657 | 1.9% |
[ 9.5% - 10.0% ] 9.51% | 111,703 | 1.1% |
[ 9.5% - 10.0% ] 9.87% | 17,632 | 1.7% |
[ 10.0% - 10.5% ] 10.08% | 106,042 | 1.1% |
[ 10.0% - 10.5% ] 10.15% | 14,042 | 0.83% |
[ 10.0% - 10.5% ] 10.46% | 77,158 | 0.27% |
[ 10.5% - 11.0% ] 10.56% | 115,767 | 0.32% |
[ 10.5% - 11.0% ] 10.94% | 32,405 | 1.4% |
[ 11.0% - 11.5% ] 11.04% | 226,206 | 0.63% |
[ 11.0% - 11.5% ] 11.25% | 27,874 | 0.71% |
[ 11.5% - 12.0% ] 11.69% | 167,741 | 0.56% |
[ 11.5% - 12.0% ] 11.97% | 93,525 | 0.50% |
[ 12.0% - 12.5% ] 12.06% | 34,748 | 0.35% |
[ 12.0% - 12.5% ] 12.31% | 53,108 | 0.34% |
[ 12.5% - 13.0% ] 12.51% | 54,358 | 0.99% |
[ 12.5% - 13.0% ] 12.87% | 34,649 | 0.54% |
[ 13.0% - 13.5% ] 13.19% | 52,360 | 0.34% |
[ 14.0% - 14.5% ] 14.36% | 98,990 | 0.40% |
[ 14.5% - 15.0% ] 14.51% | 139,247 | 0.58% |
[ 14.5% - 15.0% ] 14.73% | 49,620 | 0.40% |
[ 14.5% - 15.0% ] 14.99% | 146,584 | 1.3% |
[ 16.0% - 16.5% ] 16.09% | 56,628 | 0.72% |
[ 16.0% - 16.5% ] 16.23% | 142,992 | 0.65% |
[ 16.5% - 17.0% ] 16.76% | 49,898 | 0.45% |
[ 17.5% - 18.0% ] 17.69% | 57,599 | 0.53% |
[ 18.0% - 18.5% ] 18.13% | 27,788 | 2.1% |
[ 18.0% - 18.5% ] 18.39% | 63,648 | 0.99% |
[ 18.5% - 19.0% ] 18.75% | 57,116 | 0.89% |
[ 19.0% - 19.5% ] 19.12% | 17,123 | 1.8% |
[ 19.5% - 20.0% ] 19.79% | 42,310 | 0.53% |
[ 20.0% - 20.5% ] 20.03% | 56,319 | 0.86% |
[ 20.5% - 21.0% ] 20.60% | 60,668 | 1.0% |
[ 20.5% - 21.0% ] 20.83% | 45,357 | 2.6% |
[ 21.0% - 21.5% ] 21.48% | 58,557 | 1.0% |
[ 21.5% - 22.0% ] 21.74% | 28,660 | 0.98% |
[ 22.5% - 23.0% ] 22.65% | 34,625 | 0.70% |
[ 23.5% - 24.0% ] 23.60% | 19,704 | 1.4% |
[ 25.5% - 26.0% ] 25.55% | 21,778 | 1.3% |
[ 26.0% - 26.5% ] 26.21% | 39,890 | 0.36% |
[ 26.0% - 26.5% ] 26.22% | 39,875 | 0.36% |
[ 27.0% - 27.5% ] 27.47% | 22,966 | 1.3% |
[ 31.0% - 31.5% ] 31.00% | 86,295 | 0.51% |