States with the Fewest Births per 1,000 Women Over the Age of 35
RELATED REPORTS & OPTIONS
Lowest Birth Rate | Women 35+
United States
Compare States
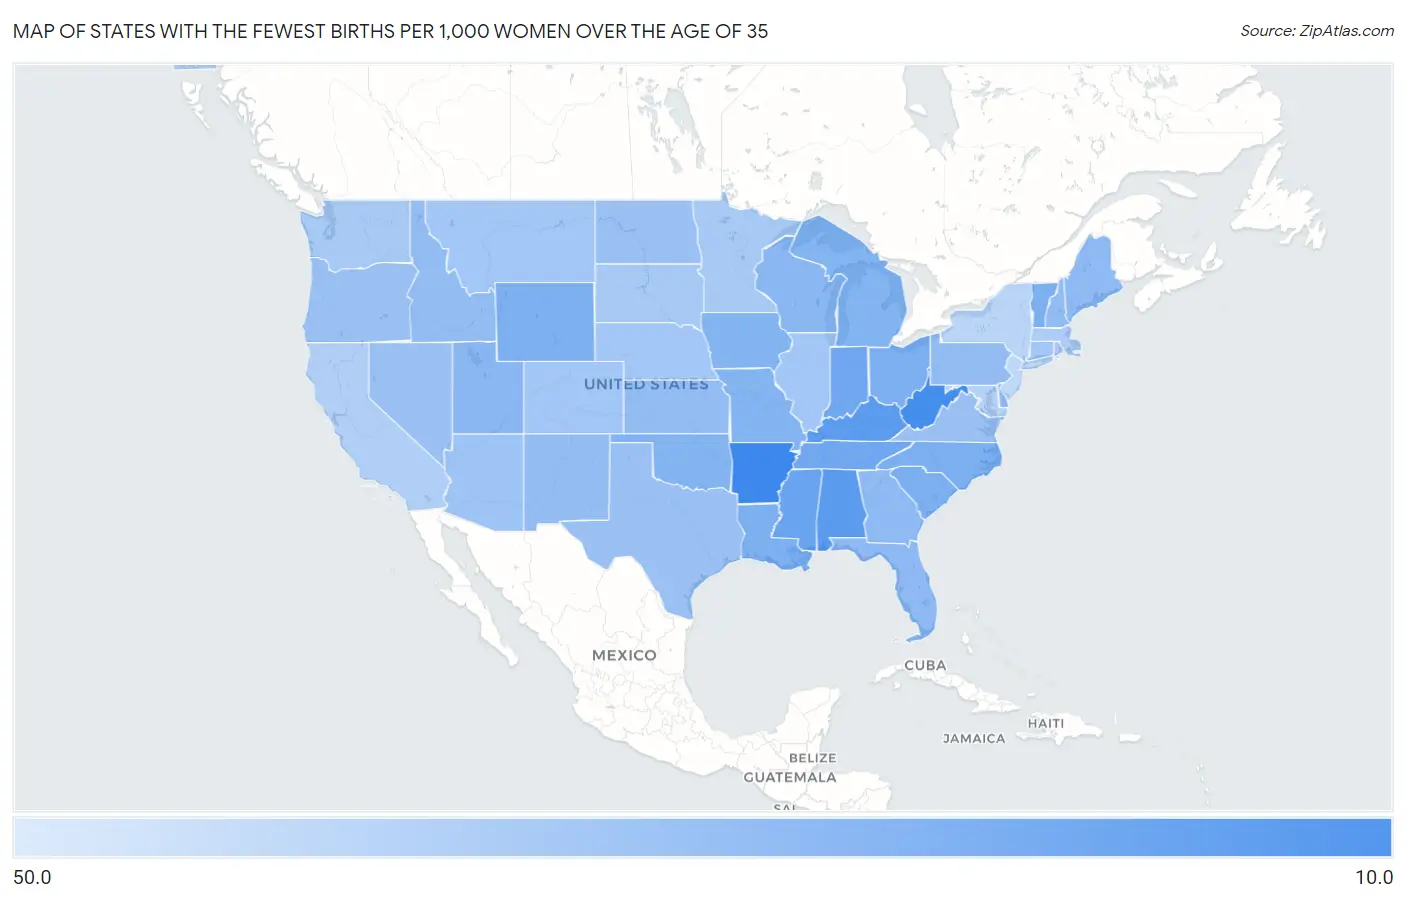
Map of States with the Fewest Births per 1,000 Women Over the Age of 35
50.0
10.0
States with the Fewest Births per 1,000 Women Over the Age of 35 in the United States
| State | Births / 1,000 Women | vs State Median | vs National | |
| 1. | Arkansas | 18.0 | 31.0 (-13.0) | 32.0(-14.0) |
| 2. | West Virginia | 19.0 | 31.0 (-12.0) | 32.0(-13.0) |
| 3. | Alabama | 22.0 | 31.0 (-9.00) | 32.0(-10.00) |
| 4. | Kentucky | 22.0 | 31.0 (-9.00) | 32.0(-10.00) |
| 5. | Mississippi | 24.0 | 31.0 (-7.00) | 32.0(-8.00) |
| 6. | Tennessee | 25.0 | 31.0 (-6.00) | 32.0(-7.00) |
| 7. | Indiana | 25.0 | 31.0 (-6.00) | 32.0(-7.00) |
| 8. | Ohio | 27.0 | 31.0 (-4.00) | 32.0(-5.00) |
| 9. | North Carolina | 27.0 | 31.0 (-4.00) | 32.0(-5.00) |
| 10. | South Carolina | 27.0 | 31.0 (-4.00) | 32.0(-5.00) |
| 11. | Louisiana | 27.0 | 31.0 (-4.00) | 32.0(-5.00) |
| 12. | Vermont | 27.0 | 31.0 (-4.00) | 32.0(-5.00) |
| 13. | Wyoming | 27.0 | 31.0 (-4.00) | 32.0(-5.00) |
| 14. | Michigan | 28.0 | 31.0 (-3.00) | 32.0(-4.00) |
| 15. | Missouri | 28.0 | 31.0 (-3.00) | 32.0(-4.00) |
| 16. | Oklahoma | 28.0 | 31.0 (-3.00) | 32.0(-4.00) |
| 17. | Iowa | 28.0 | 31.0 (-3.00) | 32.0(-4.00) |
| 18. | Wisconsin | 29.0 | 31.0 (-2.00) | 32.0(-3.00) |
| 19. | Utah | 29.0 | 31.0 (-2.00) | 32.0(-3.00) |
| 20. | Florida | 30.0 | 31.0 (-1.000) | 32.0(-2.00) |
| 21. | Georgia | 30.0 | 31.0 (-1.000) | 32.0(-2.00) |
| 22. | Maine | 30.0 | 31.0 (-1.000) | 32.0(-2.00) |
| 23. | Delaware | 30.0 | 31.0 (-1.000) | 32.0(-2.00) |
| 24. | Pennsylvania | 31.0 | 31.0 (=0.000) | 32.0(-1.000) |
| 25. | Kansas | 31.0 | 31.0 (=0.000) | 32.0(-1.000) |
| 26. | New Mexico | 31.0 | 31.0 (=0.000) | 32.0(-1.000) |
| 27. | Idaho | 31.0 | 31.0 (=0.000) | 32.0(-1.000) |
| 28. | New Hampshire | 31.0 | 31.0 (=0.000) | 32.0(-1.000) |
| 29. | Texas | 32.0 | 31.0 (+1.000) | 32.0(=0.000) |
| 30. | Virginia | 32.0 | 31.0 (+1.000) | 32.0(=0.000) |
| 31. | Oregon | 32.0 | 31.0 (+1.000) | 32.0(=0.000) |
| 32. | Nevada | 32.0 | 31.0 (+1.000) | 32.0(=0.000) |
| 33. | North Dakota | 32.0 | 31.0 (+1.000) | 32.0(=0.000) |
| 34. | Arizona | 33.0 | 31.0 (+2.00) | 32.0(+1.000) |
| 35. | Illinois | 34.0 | 31.0 (+3.00) | 32.0(+2.00) |
| 36. | Colorado | 34.0 | 31.0 (+3.00) | 32.0(+2.00) |
| 37. | Connecticut | 34.0 | 31.0 (+3.00) | 32.0(+2.00) |
| 38. | Nebraska | 34.0 | 31.0 (+3.00) | 32.0(+2.00) |
| 39. | Montana | 34.0 | 31.0 (+3.00) | 32.0(+2.00) |
| 40. | Washington | 35.0 | 31.0 (+4.00) | 32.0(+3.00) |
| 41. | Minnesota | 35.0 | 31.0 (+4.00) | 32.0(+3.00) |
| 42. | South Dakota | 35.0 | 31.0 (+4.00) | 32.0(+3.00) |
| 43. | Massachusetts | 36.0 | 31.0 (+5.00) | 32.0(+4.00) |
| 44. | Rhode Island | 36.0 | 31.0 (+5.00) | 32.0(+4.00) |
| 45. | California | 37.0 | 31.0 (+6.00) | 32.0(+5.00) |
| 46. | Maryland | 38.0 | 31.0 (+7.00) | 32.0(+6.00) |
| 47. | New York | 39.0 | 31.0 (+8.00) | 32.0(+7.00) |
| 48. | Alaska | 40.0 | 31.0 (+9.00) | 32.0(+8.00) |
| 49. | New Jersey | 41.0 | 31.0 (+10.00) | 32.0(+9.00) |
| 50. | Hawaii | 45.0 | 31.0 (+14.0) | 32.0(+13.0) |
1
Common Questions
What are the Top 10 States with the Fewest Births per 1,000 Women Over the Age of 35 in the United States?
Top 10 States with the Fewest Births per 1,000 Women Over the Age of 35 in the United States are:
#1
18.0
#2
19.0
#3
22.0
#4
22.0
#5
24.0
#6
25.0
#7
25.0
#8
27.0
#9
27.0
#10
27.0
What state has the Fewest Births per 1,000 Women Over the Age of 35 in the United States?
Arkansas has the Fewest Births per 1,000 Women Over the Age of 35 in the United States with 18.0.
What is the Number of Births per 1,000 Women Over the Age of 35 in the United States?
Number of Births per 1,000 Women Over the Age of 35 in the United States is 32.0.