Immigrants from Bolivia Disability Age Under 5

COMPARE

Immigrants from Bolivia
Race
Ancestry
AfghanAfricanAlaska NativeAlaskan AthabascanAlbanianAleutAlsatianAmericanApacheArabArapahoArgentineanArmenianAssyrian/Chaldean/SyriacAustralianAustrianBahamianBangladeshiBarbadianBasqueBelgianBelizeanBermudanBhutaneseBlackfeetBolivianBrazilianBritishBritish West IndianBulgarianBurmeseCajunCambodianCanadianCape VerdeanCarpatho RusynCelticCentral AmericanCentral American IndianCherokeeCheyenneChickasawChileanChineseChippewaChoctawColombianColvilleComancheCosta RicanCreeCreekCroatianCrowCubanCypriotCzechCzechoslovakianDanishDelawareDominicanDutchDutch West IndianEastern EuropeanEcuadorianEgyptianEnglishEstonianEthiopianEuropeanFijianFilipinoFinnishFrenchFrench American IndianFrench CanadianGermanGerman RussianGhanaianGreekGuamanian/ChamorroGuatemalanGuyaneseHaitianHmongHonduranHopiHoumaHungarianIcelanderIndian (Asian)IndonesianInupiatIranianIraqiIrishIroquoisIsraeliItalianJamaicanJapaneseJordanianKenyanKiowaKoreanLaotianLatvianLebaneseLiberianLithuanianLumbeeLuxembourgerMacedonianMalaysianMalteseMarshalleseMenomineeMexicanMexican American IndianMongolianMoroccanNative HawaiianNavajoNepaleseNew ZealanderNicaraguanNigerianNorthern EuropeanNorwegianOkinawanOsageOttawaPaiutePakistaniPalestinianPanamanianParaguayanPennsylvania GermanPeruvianPimaPolishPortuguesePotawatomiPuebloPuerto RicanPuget Sound SalishRomanianRussianSalvadoranSamoanScandinavianScotch-IrishScottishSeminoleSenegaleseSerbianShoshoneSierra LeoneanSiouxSlavicSlovakSloveneSomaliSouth AfricanSouth AmericanSouth American IndianSoviet UnionSpaniardSpanishSpanish AmericanSpanish American IndianSri LankanSubsaharan AfricanSudaneseSwedishSwissSyrianTaiwaneseThaiTlingit-HaidaTohono O'OdhamTonganTrinidadian and TobagonianTsimshianTurkishU.S. Virgin IslanderUgandanUkrainianUruguayanUteVenezuelanVietnameseWelshWest IndianYakamaYaquiYugoslavianYumanYup'ikZimbabwean
Immigration
NonimmigrantsImmigrantsAfghanistanAfricaAlbaniaArgentinaArmeniaAsiaAustraliaAustriaBahamasBangladeshBarbadosBelarusBelgiumBelizeBoliviaBosnia and HerzegovinaBrazilBulgariaBurma/MyanmarCabo VerdeCambodiaCameroonCanadaCaribbeanCentral AmericaChileChinaColombiaCongoCosta RicaCroatiaCubaCzechoslovakiaDenmarkDominicaDominican RepublicEastern AfricaEastern AsiaEastern EuropeEcuadorEgyptEl SalvadorEnglandEritreaEthiopiaEuropeFijiFranceGermanyGhanaGreeceGrenadaGuatemalaGuyanaHaitiHondurasHong KongHungaryIndiaIndonesiaIranIraqIrelandIsraelItalyJamaicaJapanJordanKazakhstanKenyaKoreaKuwaitLaosLatin AmericaLatviaLebanonLiberiaLithuaniaMalaysiaMexicoMicronesiaMiddle AfricaMoldovaMoroccoNepalNetherlandsNicaraguaNigeriaNorth AmericaNorth MacedoniaNorthern AfricaNorthern EuropeNorwayOceaniaPakistanPanamaPeruPhilippinesPolandPortugalRomaniaRussiaSaudi ArabiaScotlandSenegalSerbiaSierra LeoneSingaporeSomaliaSouth AfricaSouth AmericaSouth Central AsiaSouth Eastern AsiaSouthern EuropeSpainSri LankaSt. Vincent and the GrenadinesSudanSwedenSwitzerlandSyriaTaiwanThailandTrinidad and TobagoTurkeyUgandaUkraineUruguayUzbekistanVenezuelaVietnamWest IndiesWestern AfricaWestern AsiaWestern EuropeYemenZaireZimbabweAzores
Select to Compare
Race
Ancestry
AfghanAfricanAlaska NativeAlaskan AthabascanAlbanianAleutAlsatianAmericanApacheArabArapahoArgentineanArmenianAssyrian/Chaldean/SyriacAustralianAustrianBahamianBangladeshiBarbadianBasqueBelgianBelizeanBermudanBhutaneseBlackfeetBolivianBrazilianBritishBritish West IndianBulgarianBurmeseCajunCambodianCanadianCape VerdeanCarpatho RusynCelticCentral AmericanCentral American IndianCherokeeCheyenneChickasawChileanChineseChippewaChoctawColombianColvilleComancheCosta RicanCreeCreekCroatianCrowCubanCypriotCzechCzechoslovakianDanishDelawareDominicanDutchDutch West IndianEastern EuropeanEcuadorianEgyptianEnglishEstonianEthiopianEuropeanFijianFilipinoFinnishFrenchFrench American IndianFrench CanadianGermanGerman RussianGhanaianGreekGuamanian/ChamorroGuatemalanGuyaneseHaitianHmongHonduranHopiHoumaHungarianIcelanderIndian (Asian)IndonesianInupiatIranianIraqiIrishIroquoisIsraeliItalianJamaicanJapaneseJordanianKenyanKiowaKoreanLaotianLatvianLebaneseLiberianLithuanianLumbeeLuxembourgerMacedonianMalaysianMalteseMarshalleseMenomineeMexicanMexican American IndianMongolianMoroccanNative HawaiianNavajoNepaleseNew ZealanderNicaraguanNigerianNorthern EuropeanNorwegianOkinawanOsageOttawaPaiutePakistaniPalestinianPanamanianParaguayanPennsylvania GermanPeruvianPimaPolishPortuguesePotawatomiPuebloPuerto RicanPuget Sound SalishRomanianRussianSalvadoranSamoanScandinavianScotch-IrishScottishSeminoleSenegaleseSerbianShoshoneSierra LeoneanSiouxSlavicSlovakSloveneSomaliSouth AfricanSouth AmericanSouth American IndianSoviet UnionSpaniardSpanishSpanish AmericanSpanish American IndianSri LankanSubsaharan AfricanSudaneseSwedishSwissSyrianTaiwaneseThaiTlingit-HaidaTohono O'OdhamTonganTrinidadian and TobagonianTsimshianTurkishU.S. Virgin IslanderUgandanUkrainianUruguayanUteVenezuelanVietnameseWelshWest IndianYakamaYaquiYugoslavianYumanYup'ikZimbabwean
Immigration
NonimmigrantsImmigrantsAfghanistanAfricaAlbaniaArgentinaArmeniaAsiaAustraliaAustriaBahamasBangladeshBarbadosBelarusBelgiumBelizeBosnia and HerzegovinaBrazilBulgariaBurma/MyanmarCabo VerdeCambodiaCameroonCanadaCaribbeanCentral AmericaChileChinaColombiaCongoCosta RicaCroatiaCubaCzechoslovakiaDenmarkDominicaDominican RepublicEastern AfricaEastern AsiaEastern EuropeEcuadorEgyptEl SalvadorEnglandEritreaEthiopiaEuropeFijiFranceGermanyGhanaGreeceGrenadaGuatemalaGuyanaHaitiHondurasHong KongHungaryIndiaIndonesiaIranIraqIrelandIsraelItalyJamaicaJapanJordanKazakhstanKenyaKoreaKuwaitLaosLatin AmericaLatviaLebanonLiberiaLithuaniaMalaysiaMexicoMicronesiaMiddle AfricaMoldovaMoroccoNepalNetherlandsNicaraguaNigeriaNorth AmericaNorth MacedoniaNorthern AfricaNorthern EuropeNorwayOceaniaPakistanPanamaPeruPhilippinesPolandPortugalRomaniaRussiaSaudi ArabiaScotlandSenegalSerbiaSierra LeoneSingaporeSomaliaSouth AfricaSouth AmericaSouth Central AsiaSouth Eastern AsiaSouthern EuropeSpainSri LankaSt. Vincent and the GrenadinesSudanSwedenSwitzerlandSyriaTaiwanThailandTrinidad and TobagoTurkeyUgandaUkraineUruguayUzbekistanVenezuelaVietnamWest IndiesWestern AfricaWestern AsiaWestern EuropeYemenZaireZimbabweAzores
Disability Age Under 5
Income
Poverty
Unemployment
Labor Participation
Family Structure
Vehicle Availability
Education Level
Disability

Immigrants from Bolivia Disability Age Under 5
Exceptional

1.1%
DISABILITY | AGE UNDER 5
99.6/ 100
METRIC RATING
52nd/ 347
METRIC RANK

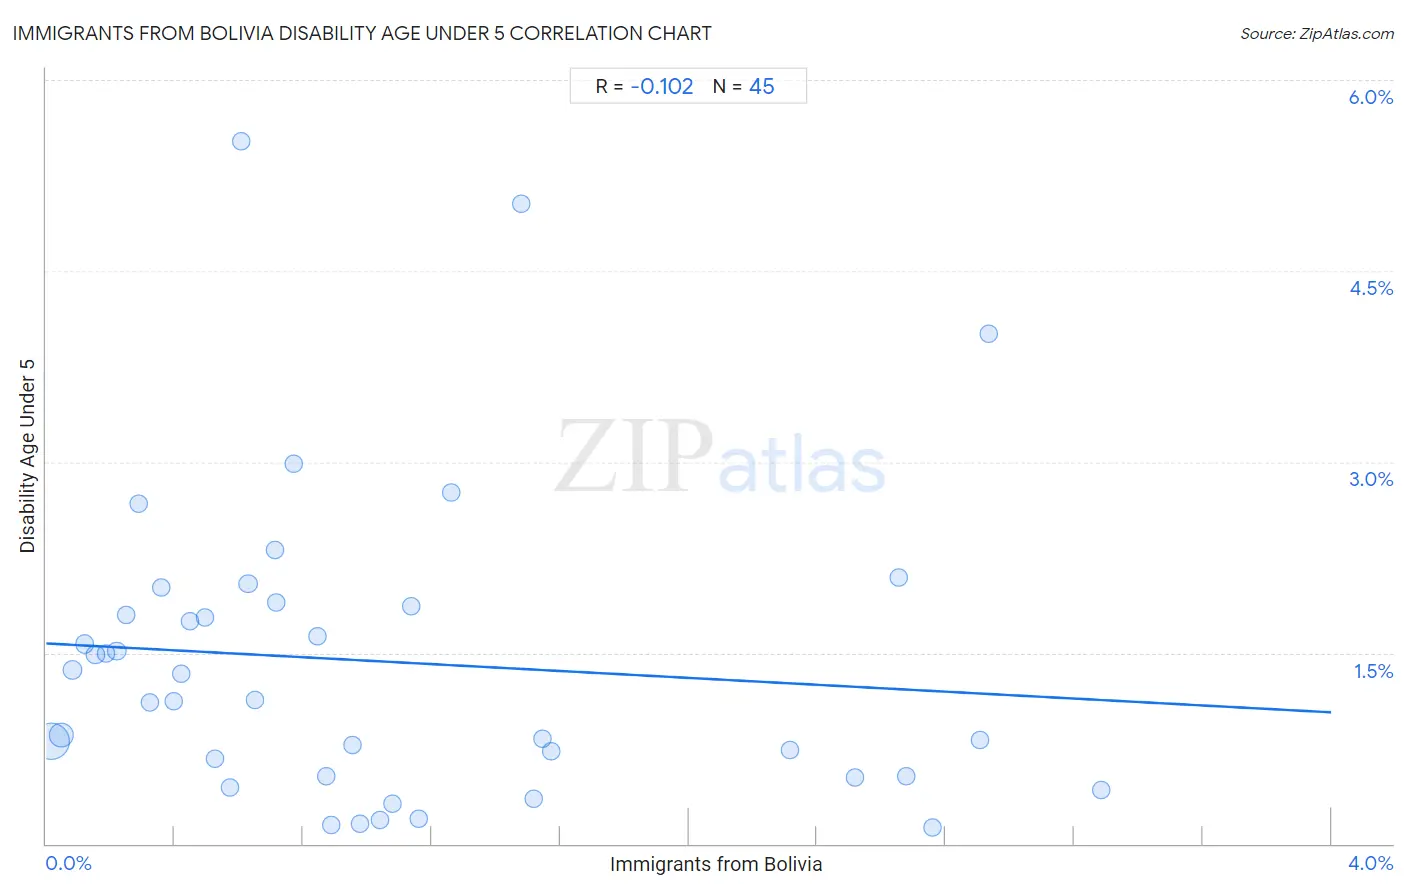
Immigrants from Bolivia Disability Age Under 5 Correlation Chart

The statistical analysis conducted on geographies consisting of 110,789,799 people shows a poor negative correlation between the proportion of Immigrants from Bolivia and percentage of population with a disability under the age of 5 in the United States with a correlation coefficient (R) of -0.102 and weighted average of 1.1%. On average, for every 1% (one percent) increase in Immigrants from Bolivia within a typical geography, there is a decrease of 0.14% in percentage of population with a disability under the age of 5.
Immigrants from Bolivia Disability Age Under 5
It is essential to understand that the correlation between the percentage of Immigrants from Bolivia and percentage of population with a disability under the age of 5 does not imply a direct cause-and-effect relationship. It remains uncertain whether the presence of Immigrants from Bolivia influences an upward or downward trend in the level of percentage of population with a disability under the age of 5 within an area, or if Immigrants from Bolivia simply ended up residing in those areas with higher or lower levels of percentage of population with a disability under the age of 5 due to other factors.

Demographics Similar to Immigrants from Bolivia by Disability Age Under 5

In terms of disability age under 5, the demographic groups most similar to Immigrants from Bolivia are Asian (1.1%, a difference of 0.31%), Immigrants from Kazakhstan (1.1%, a difference of 0.42%), Immigrants from El Salvador (1.1%, a difference of 0.60%), Immigrants from Japan (1.1%, a difference of 0.61%), and Immigrants from Russia (1.1%, a difference of 0.63%).
DemographicsRating | RankDisability Age Under 5
Immigrants from Turkey
99.8
/100
|
#45
Exceptional
1.1%
Immigrants from Congo
99.8
/100
|
#46
Exceptional
1.1%
Immigrants from Sweden
99.8
/100
|
#47
Exceptional
1.1%
Immigrants from Singapore
99.7
/100
|
#48
Exceptional
1.1%
Immigrants from Russia
99.7
/100
|
#49
Exceptional
1.1%
Immigrants from Japan
99.7
/100
|
#50
Exceptional
1.1%
Immigrants from Kazakhstan
99.7
/100
|
#51
Exceptional
1.1%
Immigrants from Bolivia
99.6
/100
|
#52
Exceptional
1.1%
Asians
99.6
/100
|
#53
Exceptional
1.1%
Immigrants from El Salvador
99.6
/100
|
#54
Exceptional
1.1%
Salvadorans
99.5
/100
|
#55
Exceptional
1.1%
Ecuadorians
99.5
/100
|
#56
Exceptional
1.1%
Assyrians/Chaldeans/Syriacs
99.5
/100
|
#57
Exceptional
1.1%
Immigrants from Egypt
99.4
/100
|
#58
Exceptional
1.1%
Immigrants from Malaysia
99.4
/100
|
#59
Exceptional
1.1%

Immigrants from Bolivia Disability Age Under 5 Correlation Summary

MeasurementImmigrants from Bolivia DataDisability Age Under 5 Data
Minimum0.016%0.13%
Maximum3.3%5.5%
Range3.3%5.4%
Mean1.1%1.4%
Median0.77%1.1%
Interquartile 25% (IQ1)0.38%0.53%
Interquartile 75% (IQ3)1.5%1.9%
Interquartile Range (IQR)1.1%1.3%
Standard Deviation (Sample)0.91%1.2%
Standard Deviation (Population)0.90%1.2%

Correlation Details

Immigrants from Bolivia PercentileSample SizeDisability Age Under 5
[
0.0%
-
0.5%
]
0.016%
70,865,9350.81%
[
0.0%
-
0.5%
]
0.047%
23,214,9150.86%
[
0.0%
-
0.5%
]
0.083%
5,157,6111.4%
[
0.0%
-
0.5%
]
0.12%
2,632,2351.6%
[
0.0%
-
0.5%
]
0.15%
1,542,4351.5%
[
0.0%
-
0.5%
]
0.19%
1,881,5281.5%
[
0.0%
-
0.5%
]
0.22%
1,079,4511.5%
[
0.0%
-
0.5%
]
0.25%
514,2861.8%
[
0.0%
-
0.5%
]
0.29%
292,2682.7%
[
0.0%
-
0.5%
]
0.32%
675,3001.1%
[
0.0%
-
0.5%
]
0.36%
98,8562.0%
[
0.0%
-
0.5%
]
0.40%
89,4431.1%
[
0.0%
-
0.5%
]
0.42%
219,3951.3%
[
0.0%
-
0.5%
]
0.45%
215,9181.8%
[
0.0%
-
0.5%
]
0.49%
219,7561.8%
[
0.5%
-
1.0%
]
0.52%
154,4240.67%
[
0.5%
-
1.0%
]
0.57%
212,8270.44%
[
0.5%
-
1.0%
]
0.61%
35,1665.5%
[
0.5%
-
1.0%
]
0.63%
126,8322.0%
[
0.5%
-
1.0%
]
0.65%
179,7051.1%
[
0.5%
-
1.0%
]
0.71%
5,6272.3%
[
0.5%
-
1.0%
]
0.72%
27,9281.9%
[
0.5%
-
1.0%
]
0.77%
41,4943.0%
[
0.5%
-
1.0%
]
0.85%
79,1381.6%
[
0.5%
-
1.0%
]
0.87%
120,5570.53%
[
0.5%
-
1.0%
]
0.89%
37,1060.15%
[
0.5%
-
1.0%
]
0.95%
49,7110.78%
[
0.5%
-
1.0%
]
0.98%
90,2100.16%
[
1.0%
-
1.5%
]
1.04%
121,1600.19%
[
1.0%
-
1.5%
]
1.08%
235,8450.31%
[
1.0%
-
1.5%
]
1.14%
48,6451.9%
[
1.0%
-
1.5%
]
1.16%
16,6200.20%
[
1.0%
-
1.5%
]
1.26%
29,2402.8%
[
1.0%
-
1.5%
]
1.48%
18,3465.0%
[
1.5%
-
2.0%
]
1.52%
73,9280.35%
[
1.5%
-
2.0%
]
1.55%
14,0420.83%
[
1.5%
-
2.0%
]
1.57%
101,8030.72%
[
2.0%
-
2.5%
]
2.32%
24,7850.74%
[
2.5%
-
3.0%
]
2.52%
58,8720.52%
[
2.5%
-
3.0%
]
2.65%
12,8182.1%
[
2.5%
-
3.0%
]
2.68%
42,3100.53%
[
2.5%
-
3.0%
]
2.76%
52,3590.13%
[
2.5%
-
3.0%
]
2.91%
19,8120.81%
[
2.5%
-
3.0%
]
2.94%
16,8274.0%
[
3.0%
-
3.5%
]
3.28%
42,3300.42%