Immigrants from Guyana Disability Age Under 5

COMPARE

Immigrants from Guyana
Race
Ancestry
AfghanAfricanAlaska NativeAlaskan AthabascanAlbanianAleutAlsatianAmericanApacheArabArapahoArgentineanArmenianAssyrian/Chaldean/SyriacAustralianAustrianBahamianBangladeshiBarbadianBasqueBelgianBelizeanBermudanBhutaneseBlackfeetBolivianBrazilianBritishBritish West IndianBulgarianBurmeseCajunCambodianCanadianCape VerdeanCarpatho RusynCelticCentral AmericanCentral American IndianCherokeeCheyenneChickasawChileanChineseChippewaChoctawColombianColvilleComancheCosta RicanCreeCreekCroatianCrowCubanCypriotCzechCzechoslovakianDanishDelawareDominicanDutchDutch West IndianEastern EuropeanEcuadorianEgyptianEnglishEstonianEthiopianEuropeanFijianFilipinoFinnishFrenchFrench American IndianFrench CanadianGermanGerman RussianGhanaianGreekGuamanian/ChamorroGuatemalanGuyaneseHaitianHmongHonduranHopiHoumaHungarianIcelanderIndian (Asian)IndonesianInupiatIranianIraqiIrishIroquoisIsraeliItalianJamaicanJapaneseJordanianKenyanKiowaKoreanLaotianLatvianLebaneseLiberianLithuanianLumbeeLuxembourgerMacedonianMalaysianMalteseMarshalleseMenomineeMexicanMexican American IndianMongolianMoroccanNative HawaiianNavajoNepaleseNew ZealanderNicaraguanNigerianNorthern EuropeanNorwegianOkinawanOsageOttawaPaiutePakistaniPalestinianPanamanianParaguayanPennsylvania GermanPeruvianPimaPolishPortuguesePotawatomiPuebloPuerto RicanPuget Sound SalishRomanianRussianSalvadoranSamoanScandinavianScotch-IrishScottishSeminoleSenegaleseSerbianShoshoneSierra LeoneanSiouxSlavicSlovakSloveneSomaliSouth AfricanSouth AmericanSouth American IndianSoviet UnionSpaniardSpanishSpanish AmericanSpanish American IndianSri LankanSubsaharan AfricanSudaneseSwedishSwissSyrianTaiwaneseThaiTlingit-HaidaTohono O'OdhamTonganTrinidadian and TobagonianTsimshianTurkishU.S. Virgin IslanderUgandanUkrainianUruguayanUteVenezuelanVietnameseWelshWest IndianYakamaYaquiYugoslavianYumanYup'ikZimbabwean
Immigration
NonimmigrantsImmigrantsAfghanistanAfricaAlbaniaArgentinaArmeniaAsiaAustraliaAustriaBahamasBangladeshBarbadosBelarusBelgiumBelizeBoliviaBosnia and HerzegovinaBrazilBulgariaBurma/MyanmarCabo VerdeCambodiaCameroonCanadaCaribbeanCentral AmericaChileChinaColombiaCongoCosta RicaCroatiaCubaCzechoslovakiaDenmarkDominicaDominican RepublicEastern AfricaEastern AsiaEastern EuropeEcuadorEgyptEl SalvadorEnglandEritreaEthiopiaEuropeFijiFranceGermanyGhanaGreeceGrenadaGuatemalaGuyanaHaitiHondurasHong KongHungaryIndiaIndonesiaIranIraqIrelandIsraelItalyJamaicaJapanJordanKazakhstanKenyaKoreaKuwaitLaosLatin AmericaLatviaLebanonLiberiaLithuaniaMalaysiaMexicoMicronesiaMiddle AfricaMoldovaMoroccoNepalNetherlandsNicaraguaNigeriaNorth AmericaNorth MacedoniaNorthern AfricaNorthern EuropeNorwayOceaniaPakistanPanamaPeruPhilippinesPolandPortugalRomaniaRussiaSaudi ArabiaScotlandSenegalSerbiaSierra LeoneSingaporeSomaliaSouth AfricaSouth AmericaSouth Central AsiaSouth Eastern AsiaSouthern EuropeSpainSri LankaSt. Vincent and the GrenadinesSudanSwedenSwitzerlandSyriaTaiwanThailandTrinidad and TobagoTurkeyUgandaUkraineUruguayUzbekistanVenezuelaVietnamWest IndiesWestern AfricaWestern AsiaWestern EuropeYemenZaireZimbabweAzores
Select to Compare
Race
Ancestry
AfghanAfricanAlaska NativeAlaskan AthabascanAlbanianAleutAlsatianAmericanApacheArabArapahoArgentineanArmenianAssyrian/Chaldean/SyriacAustralianAustrianBahamianBangladeshiBarbadianBasqueBelgianBelizeanBermudanBhutaneseBlackfeetBolivianBrazilianBritishBritish West IndianBulgarianBurmeseCajunCambodianCanadianCape VerdeanCarpatho RusynCelticCentral AmericanCentral American IndianCherokeeCheyenneChickasawChileanChineseChippewaChoctawColombianColvilleComancheCosta RicanCreeCreekCroatianCrowCubanCypriotCzechCzechoslovakianDanishDelawareDominicanDutchDutch West IndianEastern EuropeanEcuadorianEgyptianEnglishEstonianEthiopianEuropeanFijianFilipinoFinnishFrenchFrench American IndianFrench CanadianGermanGerman RussianGhanaianGreekGuamanian/ChamorroGuatemalanGuyaneseHaitianHmongHonduranHopiHoumaHungarianIcelanderIndian (Asian)IndonesianInupiatIranianIraqiIrishIroquoisIsraeliItalianJamaicanJapaneseJordanianKenyanKiowaKoreanLaotianLatvianLebaneseLiberianLithuanianLumbeeLuxembourgerMacedonianMalaysianMalteseMarshalleseMenomineeMexicanMexican American IndianMongolianMoroccanNative HawaiianNavajoNepaleseNew ZealanderNicaraguanNigerianNorthern EuropeanNorwegianOkinawanOsageOttawaPaiutePakistaniPalestinianPanamanianParaguayanPennsylvania GermanPeruvianPimaPolishPortuguesePotawatomiPuebloPuerto RicanPuget Sound SalishRomanianRussianSalvadoranSamoanScandinavianScotch-IrishScottishSeminoleSenegaleseSerbianShoshoneSierra LeoneanSiouxSlavicSlovakSloveneSomaliSouth AfricanSouth AmericanSouth American IndianSoviet UnionSpaniardSpanishSpanish AmericanSpanish American IndianSri LankanSubsaharan AfricanSudaneseSwedishSwissSyrianTaiwaneseThaiTlingit-HaidaTohono O'OdhamTonganTrinidadian and TobagonianTsimshianTurkishU.S. Virgin IslanderUgandanUkrainianUruguayanUteVenezuelanVietnameseWelshWest IndianYakamaYaquiYugoslavianYumanYup'ikZimbabwean
Immigration
NonimmigrantsImmigrantsAfghanistanAfricaAlbaniaArgentinaArmeniaAsiaAustraliaAustriaBahamasBangladeshBarbadosBelarusBelgiumBelizeBoliviaBosnia and HerzegovinaBrazilBulgariaBurma/MyanmarCabo VerdeCambodiaCameroonCanadaCaribbeanCentral AmericaChileChinaColombiaCongoCosta RicaCroatiaCubaCzechoslovakiaDenmarkDominicaDominican RepublicEastern AfricaEastern AsiaEastern EuropeEcuadorEgyptEl SalvadorEnglandEritreaEthiopiaEuropeFijiFranceGermanyGhanaGreeceGrenadaGuatemalaHaitiHondurasHong KongHungaryIndiaIndonesiaIranIraqIrelandIsraelItalyJamaicaJapanJordanKazakhstanKenyaKoreaKuwaitLaosLatin AmericaLatviaLebanonLiberiaLithuaniaMalaysiaMexicoMicronesiaMiddle AfricaMoldovaMoroccoNepalNetherlandsNicaraguaNigeriaNorth AmericaNorth MacedoniaNorthern AfricaNorthern EuropeNorwayOceaniaPakistanPanamaPeruPhilippinesPolandPortugalRomaniaRussiaSaudi ArabiaScotlandSenegalSerbiaSierra LeoneSingaporeSomaliaSouth AfricaSouth AmericaSouth Central AsiaSouth Eastern AsiaSouthern EuropeSpainSri LankaSt. Vincent and the GrenadinesSudanSwedenSwitzerlandSyriaTaiwanThailandTrinidad and TobagoTurkeyUgandaUkraineUruguayUzbekistanVenezuelaVietnamWest IndiesWestern AfricaWestern AsiaWestern EuropeYemenZaireZimbabweAzores
Disability Age Under 5
Income
Poverty
Unemployment
Labor Participation
Family Structure
Vehicle Availability
Education Level
Disability

Immigrants from Guyana Disability Age Under 5
Exceptional

1.0%
DISABILITY | AGE UNDER 5
99.9/ 100
METRIC RATING
38th/ 347
METRIC RANK

Immigrants from Guyana Disability Age Under 5 Correlation Chart

The statistical analysis conducted on geographies consisting of 116,239,844 people shows no correlation between the proportion of Immigrants from Guyana and percentage of population with a disability under the age of 5 in the United States with a correlation coefficient (R) of 0.032 and weighted average of 1.0%. On average, for every 1% (one percent) increase in Immigrants from Guyana within a typical geography, there is an increase of 0.0090% in percentage of population with a disability under the age of 5.
Immigrants from Guyana Disability Age Under 5
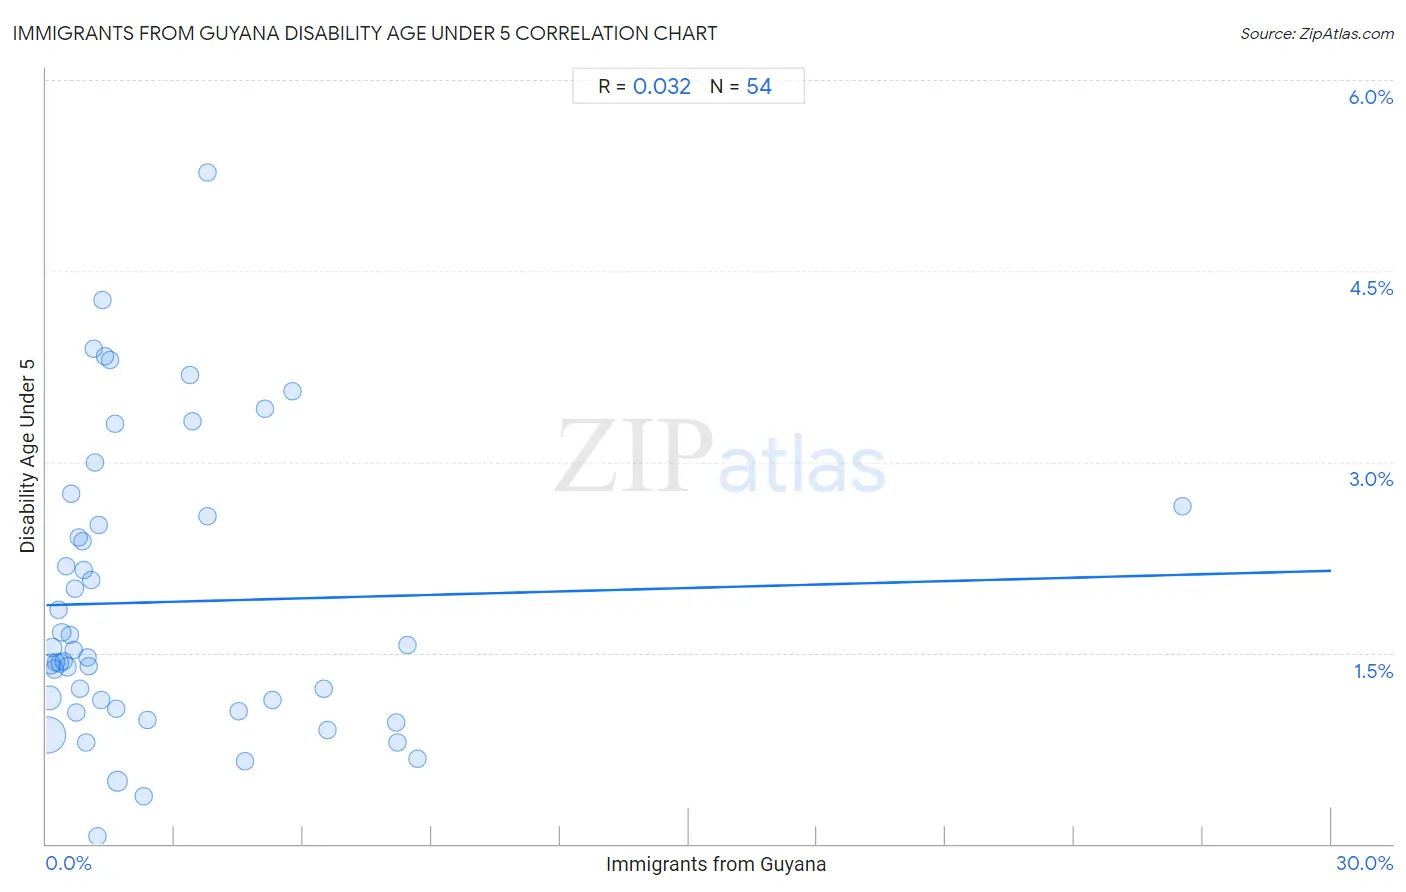
It is essential to understand that the correlation between the percentage of Immigrants from Guyana and percentage of population with a disability under the age of 5 does not imply a direct cause-and-effect relationship. It remains uncertain whether the presence of Immigrants from Guyana influences an upward or downward trend in the level of percentage of population with a disability under the age of 5 within an area, or if Immigrants from Guyana simply ended up residing in those areas with higher or lower levels of percentage of population with a disability under the age of 5 due to other factors.

Demographics Similar to Immigrants from Guyana by Disability Age Under 5

In terms of disability age under 5, the demographic groups most similar to Immigrants from Guyana are Immigrants from India (1.0%, a difference of 0.080%), Immigrants from Nepal (1.0%, a difference of 0.11%), Filipino (1.1%, a difference of 0.67%), Barbadian (1.0%, a difference of 0.82%), and Immigrants from Albania (1.1%, a difference of 1.0%).
DemographicsRating | RankDisability Age Under 5
Armenians
99.9
/100
|
#31
Exceptional
1.0%
Iranians
99.9
/100
|
#32
Exceptional
1.0%
Bolivians
99.9
/100
|
#33
Exceptional
1.0%
Immigrants from Ukraine
99.9
/100
|
#34
Exceptional
1.0%
Barbadians
99.9
/100
|
#35
Exceptional
1.0%
Immigrants from Nepal
99.9
/100
|
#36
Exceptional
1.0%
Immigrants from India
99.9
/100
|
#37
Exceptional
1.0%
Immigrants from Guyana
99.9
/100
|
#38
Exceptional
1.0%
Filipinos
99.9
/100
|
#39
Exceptional
1.1%
Immigrants from Albania
99.9
/100
|
#40
Exceptional
1.1%
Thais
99.8
/100
|
#41
Exceptional
1.1%
Immigrants from Bulgaria
99.8
/100
|
#42
Exceptional
1.1%
Pima
99.8
/100
|
#43
Exceptional
1.1%
Immigrants from Asia
99.8
/100
|
#44
Exceptional
1.1%
Immigrants from Turkey
99.8
/100
|
#45
Exceptional
1.1%

Immigrants from Guyana Disability Age Under 5 Correlation Summary

MeasurementImmigrants from Guyana DataDisability Age Under 5 Data
Minimum0.015%0.063%
Maximum26.5%5.3%
Range26.5%5.2%
Mean2.7%1.9%
Median1.2%1.5%
Interquartile 25% (IQ1)0.58%1.1%
Interquartile 75% (IQ3)3.8%2.6%
Interquartile Range (IQR)3.2%1.5%
Standard Deviation (Sample)4.1%1.1%
Standard Deviation (Population)4.1%1.1%

Correlation Details

Immigrants from Guyana PercentileSample SizeDisability Age Under 5
[
0.0%
-
0.5%
]
0.015%
64,224,2050.85%
[
0.0%
-
0.5%
]
0.064%
18,833,5171.1%
[
0.0%
-
0.5%
]
0.10%
6,396,1081.4%
[
0.0%
-
0.5%
]
0.15%
3,677,5351.5%
[
0.0%
-
0.5%
]
0.19%
2,288,3701.4%
[
0.0%
-
0.5%
]
0.24%
1,453,1131.4%
[
0.0%
-
0.5%
]
0.28%
1,166,9231.8%
[
0.0%
-
0.5%
]
0.32%
1,567,5201.4%
[
0.0%
-
0.5%
]
0.36%
826,4061.7%
[
0.0%
-
0.5%
]
0.41%
873,1391.4%
[
0.0%
-
0.5%
]
0.46%
437,1702.2%
[
0.0%
-
0.5%
]
0.49%
485,7321.4%
[
0.5%
-
1.0%
]
0.54%
721,1451.6%
[
0.5%
-
1.0%
]
0.58%
416,1922.8%
[
0.5%
-
1.0%
]
0.63%
395,7831.5%
[
0.5%
-
1.0%
]
0.68%
446,4502.0%
[
0.5%
-
1.0%
]
0.71%
196,1981.0%
[
0.5%
-
1.0%
]
0.75%
157,7362.4%
[
0.5%
-
1.0%
]
0.78%
173,9991.2%
[
0.5%
-
1.0%
]
0.85%
138,1332.4%
[
0.5%
-
1.0%
]
0.87%
94,8312.2%
[
0.5%
-
1.0%
]
0.94%
428,7780.80%
[
0.5%
-
1.0%
]
0.97%
234,0311.5%
[
1.0%
-
1.5%
]
1.00%
316,7201.4%
[
1.0%
-
1.5%
]
1.06%
35,3182.1%
[
1.0%
-
1.5%
]
1.10%
52,7683.9%
[
1.0%
-
1.5%
]
1.13%
76,4843.0%
[
1.0%
-
1.5%
]
1.19%
98,7130.063%
[
1.0%
-
1.5%
]
1.23%
52,5722.5%
[
1.0%
-
1.5%
]
1.28%
49,7381.1%
[
1.0%
-
1.5%
]
1.32%
49,8474.3%
[
1.0%
-
1.5%
]
1.37%
84,5533.8%
[
1.0%
-
1.5%
]
1.49%
26,0403.8%
[
1.5%
-
2.0%
]
1.60%
22,1373.3%
[
1.5%
-
2.0%
]
1.63%
83,2211.1%
[
1.5%
-
2.0%
]
1.67%
8,622,4670.49%
[
2.0%
-
2.5%
]
2.28%
105,6590.38%
[
2.0%
-
2.5%
]
2.35%
41,9070.97%
[
3.0%
-
3.5%
]
3.35%
6,6613.7%
[
3.0%
-
3.5%
]
3.42%
43,3963.3%
[
3.5%
-
4.0%
]
3.75%
19,0165.3%
[
3.5%
-
4.0%
]
3.77%
92,5882.6%
[
4.0%
-
4.5%
]
4.48%
134,6331.0%
[
4.5%
-
5.0%
]
4.64%
100,0820.65%
[
5.0%
-
5.5%
]
5.12%
15,4593.4%
[
5.0%
-
5.5%
]
5.30%
44,8321.1%
[
5.5%
-
6.0%
]
5.74%
27,8453.6%
[
6.0%
-
6.5%
]
6.47%
108,1801.2%
[
6.5%
-
7.0%
]
6.56%
78,5060.89%
[
8.0%
-
8.5%
]
8.16%
38,8650.95%
[
8.0%
-
8.5%
]
8.19%
31,2000.79%
[
8.0%
-
8.5%
]
8.44%
27,7941.6%
[
8.5%
-
9.0%
]
8.66%
68,4760.67%
[
26.5%
-
27.0%
]
26.52%
51,1532.7%