Dutch Disability Age Under 5

COMPARE

Dutch
Race
Ancestry
AfghanAfricanAlaska NativeAlaskan AthabascanAlbanianAleutAlsatianAmericanApacheArabArapahoArgentineanArmenianAssyrian/Chaldean/SyriacAustralianAustrianBahamianBangladeshiBarbadianBasqueBelgianBelizeanBermudanBhutaneseBlackfeetBolivianBrazilianBritishBritish West IndianBulgarianBurmeseCajunCambodianCanadianCape VerdeanCarpatho RusynCelticCentral AmericanCentral American IndianCherokeeCheyenneChickasawChileanChineseChippewaChoctawColombianColvilleComancheCosta RicanCreeCreekCroatianCrowCubanCypriotCzechCzechoslovakianDanishDelawareDominicanDutchDutch West IndianEastern EuropeanEcuadorianEgyptianEnglishEstonianEthiopianEuropeanFijianFilipinoFinnishFrenchFrench American IndianFrench CanadianGermanGerman RussianGhanaianGreekGuamanian/ChamorroGuatemalanGuyaneseHaitianHmongHonduranHopiHoumaHungarianIcelanderIndian (Asian)IndonesianInupiatIranianIraqiIrishIroquoisIsraeliItalianJamaicanJapaneseJordanianKenyanKiowaKoreanLaotianLatvianLebaneseLiberianLithuanianLumbeeLuxembourgerMacedonianMalaysianMalteseMarshalleseMenomineeMexicanMexican American IndianMongolianMoroccanNative HawaiianNavajoNepaleseNew ZealanderNicaraguanNigerianNorthern EuropeanNorwegianOkinawanOsageOttawaPaiutePakistaniPalestinianPanamanianParaguayanPennsylvania GermanPeruvianPimaPolishPortuguesePotawatomiPuebloPuerto RicanPuget Sound SalishRomanianRussianSalvadoranSamoanScandinavianScotch-IrishScottishSeminoleSenegaleseSerbianShoshoneSierra LeoneanSiouxSlavicSlovakSloveneSomaliSouth AfricanSouth AmericanSouth American IndianSoviet UnionSpaniardSpanishSpanish AmericanSpanish American IndianSri LankanSubsaharan AfricanSudaneseSwedishSwissSyrianTaiwaneseThaiTlingit-HaidaTohono O'OdhamTonganTrinidadian and TobagonianTsimshianTurkishU.S. Virgin IslanderUgandanUkrainianUruguayanUteVenezuelanVietnameseWelshWest IndianYakamaYaquiYugoslavianYumanYup'ikZimbabwean
Immigration
NonimmigrantsImmigrantsAfghanistanAfricaAlbaniaArgentinaArmeniaAsiaAustraliaAustriaBahamasBangladeshBarbadosBelarusBelgiumBelizeBoliviaBosnia and HerzegovinaBrazilBulgariaBurma/MyanmarCabo VerdeCambodiaCameroonCanadaCaribbeanCentral AmericaChileChinaColombiaCongoCosta RicaCroatiaCubaCzechoslovakiaDenmarkDominicaDominican RepublicEastern AfricaEastern AsiaEastern EuropeEcuadorEgyptEl SalvadorEnglandEritreaEthiopiaEuropeFijiFranceGermanyGhanaGreeceGrenadaGuatemalaGuyanaHaitiHondurasHong KongHungaryIndiaIndonesiaIranIraqIrelandIsraelItalyJamaicaJapanJordanKazakhstanKenyaKoreaKuwaitLaosLatin AmericaLatviaLebanonLiberiaLithuaniaMalaysiaMexicoMicronesiaMiddle AfricaMoldovaMoroccoNepalNetherlandsNicaraguaNigeriaNorth AmericaNorth MacedoniaNorthern AfricaNorthern EuropeNorwayOceaniaPakistanPanamaPeruPhilippinesPolandPortugalRomaniaRussiaSaudi ArabiaScotlandSenegalSerbiaSierra LeoneSingaporeSomaliaSouth AfricaSouth AmericaSouth Central AsiaSouth Eastern AsiaSouthern EuropeSpainSri LankaSt. Vincent and the GrenadinesSudanSwedenSwitzerlandSyriaTaiwanThailandTrinidad and TobagoTurkeyUgandaUkraineUruguayUzbekistanVenezuelaVietnamWest IndiesWestern AfricaWestern AsiaWestern EuropeYemenZaireZimbabweAzores
Select to Compare
Race
Ancestry
AfghanAfricanAlaska NativeAlaskan AthabascanAlbanianAleutAlsatianAmericanApacheArabArapahoArgentineanArmenianAssyrian/Chaldean/SyriacAustralianAustrianBahamianBangladeshiBarbadianBasqueBelgianBelizeanBermudanBhutaneseBlackfeetBolivianBrazilianBritishBritish West IndianBulgarianBurmeseCajunCambodianCanadianCape VerdeanCarpatho RusynCelticCentral AmericanCentral American IndianCherokeeCheyenneChickasawChileanChineseChippewaChoctawColombianColvilleComancheCosta RicanCreeCreekCroatianCrowCubanCypriotCzechCzechoslovakianDanishDelawareDominicanDutch West IndianEastern EuropeanEcuadorianEgyptianEnglishEstonianEthiopianEuropeanFijianFilipinoFinnishFrenchFrench American IndianFrench CanadianGermanGerman RussianGhanaianGreekGuamanian/ChamorroGuatemalanGuyaneseHaitianHmongHonduranHopiHoumaHungarianIcelanderIndian (Asian)IndonesianInupiatIranianIraqiIrishIroquoisIsraeliItalianJamaicanJapaneseJordanianKenyanKiowaKoreanLaotianLatvianLebaneseLiberianLithuanianLumbeeLuxembourgerMacedonianMalaysianMalteseMarshalleseMenomineeMexicanMexican American IndianMongolianMoroccanNative HawaiianNavajoNepaleseNew ZealanderNicaraguanNigerianNorthern EuropeanNorwegianOkinawanOsageOttawaPaiutePakistaniPalestinianPanamanianParaguayanPennsylvania GermanPeruvianPimaPolishPortuguesePotawatomiPuebloPuerto RicanPuget Sound SalishRomanianRussianSalvadoranSamoanScandinavianScotch-IrishScottishSeminoleSenegaleseSerbianShoshoneSierra LeoneanSiouxSlavicSlovakSloveneSomaliSouth AfricanSouth AmericanSouth American IndianSoviet UnionSpaniardSpanishSpanish AmericanSpanish American IndianSri LankanSubsaharan AfricanSudaneseSwedishSwissSyrianTaiwaneseThaiTlingit-HaidaTohono O'OdhamTonganTrinidadian and TobagonianTsimshianTurkishU.S. Virgin IslanderUgandanUkrainianUruguayanUteVenezuelanVietnameseWelshWest IndianYakamaYaquiYugoslavianYumanYup'ikZimbabwean
Immigration
NonimmigrantsImmigrantsAfghanistanAfricaAlbaniaArgentinaArmeniaAsiaAustraliaAustriaBahamasBangladeshBarbadosBelarusBelgiumBelizeBoliviaBosnia and HerzegovinaBrazilBulgariaBurma/MyanmarCabo VerdeCambodiaCameroonCanadaCaribbeanCentral AmericaChileChinaColombiaCongoCosta RicaCroatiaCubaCzechoslovakiaDenmarkDominicaDominican RepublicEastern AfricaEastern AsiaEastern EuropeEcuadorEgyptEl SalvadorEnglandEritreaEthiopiaEuropeFijiFranceGermanyGhanaGreeceGrenadaGuatemalaGuyanaHaitiHondurasHong KongHungaryIndiaIndonesiaIranIraqIrelandIsraelItalyJamaicaJapanJordanKazakhstanKenyaKoreaKuwaitLaosLatin AmericaLatviaLebanonLiberiaLithuaniaMalaysiaMexicoMicronesiaMiddle AfricaMoldovaMoroccoNepalNetherlandsNicaraguaNigeriaNorth AmericaNorth MacedoniaNorthern AfricaNorthern EuropeNorwayOceaniaPakistanPanamaPeruPhilippinesPolandPortugalRomaniaRussiaSaudi ArabiaScotlandSenegalSerbiaSierra LeoneSingaporeSomaliaSouth AfricaSouth AmericaSouth Central AsiaSouth Eastern AsiaSouthern EuropeSpainSri LankaSt. Vincent and the GrenadinesSudanSwedenSwitzerlandSyriaTaiwanThailandTrinidad and TobagoTurkeyUgandaUkraineUruguayUzbekistanVenezuelaVietnamWest IndiesWestern AfricaWestern AsiaWestern EuropeYemenZaireZimbabweAzores
Disability Age Under 5
Income
Poverty
Unemployment
Labor Participation
Family Structure
Vehicle Availability
Education Level
Disability

Dutch Disability Age Under 5
Tragic

1.7%
DISABILITY | AGE UNDER 5
0.0/ 100
METRIC RATING
315th/ 347
METRIC RANK

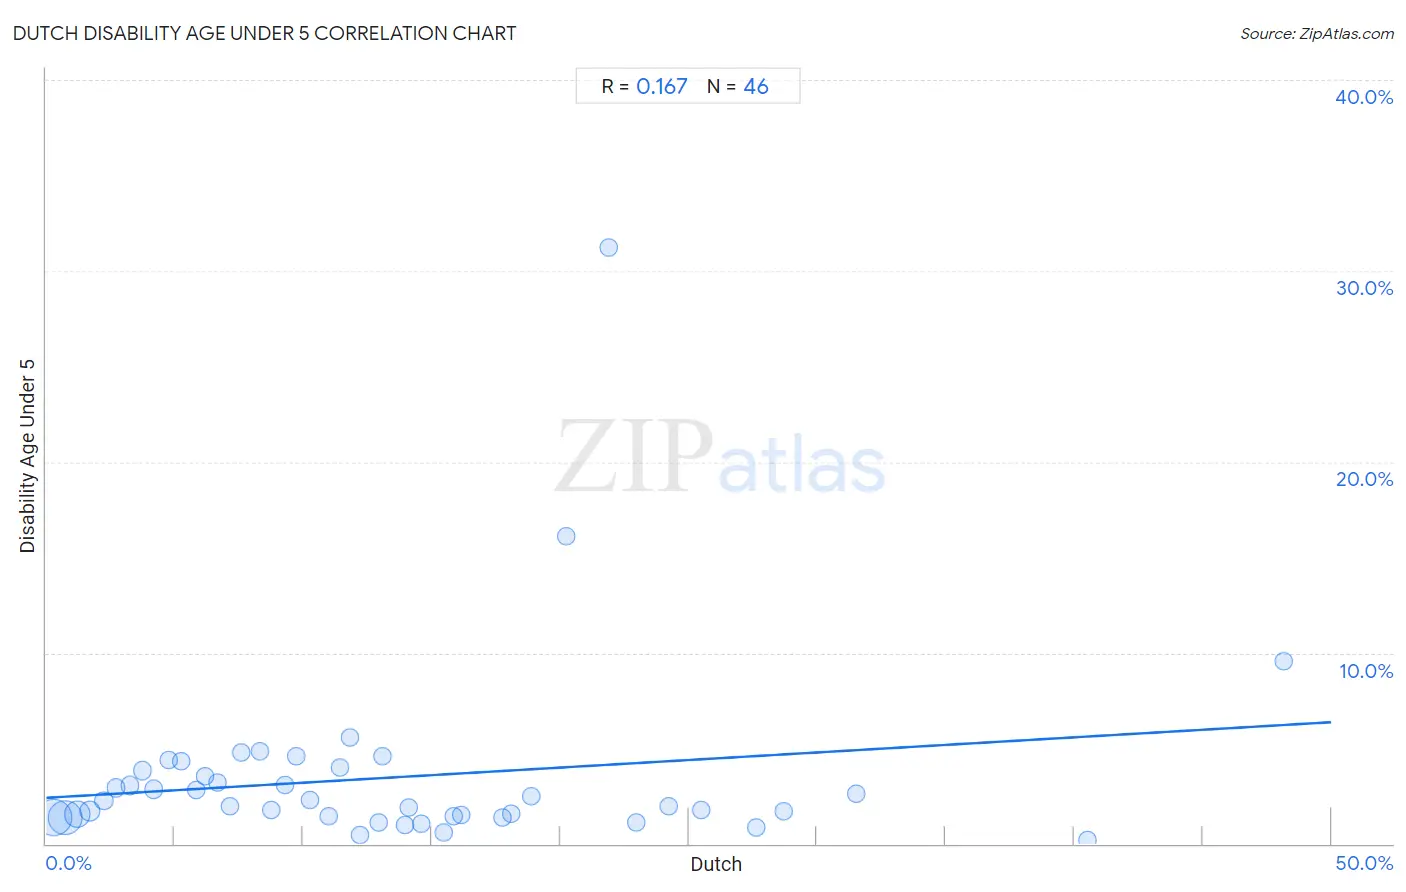
Dutch Disability Age Under 5 Correlation Chart

The statistical analysis conducted on geographies consisting of 256,007,977 people shows a poor positive correlation between the proportion of Dutch and percentage of population with a disability under the age of 5 in the United States with a correlation coefficient (R) of 0.167 and weighted average of 1.7%. On average, for every 1% (one percent) increase in Dutch within a typical geography, there is an increase of 0.079% in percentage of population with a disability under the age of 5.
Dutch Disability Age Under 5
It is essential to understand that the correlation between the percentage of Dutch and percentage of population with a disability under the age of 5 does not imply a direct cause-and-effect relationship. It remains uncertain whether the presence of Dutch influences an upward or downward trend in the level of percentage of population with a disability under the age of 5 within an area, or if Dutch simply ended up residing in those areas with higher or lower levels of percentage of population with a disability under the age of 5 due to other factors.

Demographics Similar to Dutch by Disability Age Under 5

In terms of disability age under 5, the demographic groups most similar to Dutch are Immigrants from Cabo Verde (1.7%, a difference of 0.18%), Norwegian (1.7%, a difference of 0.26%), Celtic (1.7%, a difference of 0.42%), Puerto Rican (1.7%, a difference of 0.58%), and French (1.7%, a difference of 0.61%).
DemographicsRating | RankDisability Age Under 5
Navajo
0.0
/100
|
#308
Tragic
1.6%
Cape Verdeans
0.0
/100
|
#309
Tragic
1.7%
Whites/Caucasians
0.0
/100
|
#310
Tragic
1.7%
English
0.0
/100
|
#311
Tragic
1.7%
Puerto Ricans
0.0
/100
|
#312
Tragic
1.7%
Celtics
0.0
/100
|
#313
Tragic
1.7%
Norwegians
0.0
/100
|
#314
Tragic
1.7%
Dutch
0.0
/100
|
#315
Tragic
1.7%
Immigrants from Cabo Verde
0.0
/100
|
#316
Tragic
1.7%
French
0.0
/100
|
#317
Tragic
1.7%
Irish
0.0
/100
|
#318
Tragic
1.7%
Slovaks
0.0
/100
|
#319
Tragic
1.7%
Scotch-Irish
0.0
/100
|
#320
Tragic
1.7%
Ottawa
0.0
/100
|
#321
Tragic
1.7%
Germans
0.0
/100
|
#322
Tragic
1.7%

Dutch Disability Age Under 5 Correlation Summary

MeasurementDutch DataDisability Age Under 5 Data
Minimum0.28%0.18%
Maximum48.2%31.2%
Range47.9%31.1%
Mean13.4%3.5%
Median11.6%2.1%
Interquartile 25% (IQ1)5.8%1.5%
Interquartile 75% (IQ3)18.1%3.8%
Interquartile Range (IQR)12.3%2.4%
Standard Deviation (Sample)10.4%4.9%
Standard Deviation (Population)10.3%4.9%

Correlation Details

Dutch PercentileSample SizeDisability Age Under 5
[
0.0%
-
0.5%
]
0.28%
100,846,8041.3%
[
0.5%
-
1.0%
]
0.73%
85,629,7041.4%
[
1.0%
-
1.5%
]
1.21%
42,559,7801.6%
[
1.5%
-
2.0%
]
1.71%
15,095,6691.7%
[
2.0%
-
2.5%
]
2.23%
5,397,4222.2%
[
2.5%
-
3.0%
]
2.70%
2,492,1102.9%
[
3.0%
-
3.5%
]
3.24%
1,153,8533.0%
[
3.5%
-
4.0%
]
3.75%
485,0813.8%
[
4.0%
-
4.5%
]
4.19%
386,2922.8%
[
4.5%
-
5.0%
]
4.76%
148,3284.4%
[
5.0%
-
5.5%
]
5.27%
138,9884.3%
[
5.5%
-
6.0%
]
5.83%
303,5742.8%
[
6.0%
-
6.5%
]
6.20%
90,5813.5%
[
6.5%
-
7.0%
]
6.64%
94,4533.2%
[
7.0%
-
7.5%
]
7.15%
51,8392.0%
[
7.5%
-
8.0%
]
7.59%
29,4684.8%
[
8.0%
-
8.5%
]
8.31%
45,0324.8%
[
8.5%
-
9.0%
]
8.76%
102,4351.7%
[
9.0%
-
9.5%
]
9.30%
81,4553.1%
[
9.5%
-
10.0%
]
9.73%
28,6314.6%
[
10.0%
-
10.5%
]
10.27%
58,2652.3%
[
10.5%
-
11.0%
]
10.99%
14,4371.5%
[
11.0%
-
11.5%
]
11.41%
4,9944.0%
[
11.5%
-
12.0%
]
11.84%
17,4035.6%
[
12.0%
-
12.5%
]
12.19%
207,8540.47%
[
12.5%
-
13.0%
]
12.92%
29,0271.1%
[
13.0%
-
13.5%
]
13.09%
7,2494.6%
[
13.5%
-
14.0%
]
13.95%
28,5491.00%
[
14.0%
-
14.5%
]
14.10%
22,4261.9%
[
14.5%
-
15.0%
]
14.62%
3,1611.1%
[
15.0%
-
15.5%
]
15.47%
31,1930.56%
[
15.5%
-
16.0%
]
15.84%
133,1161.5%
[
16.0%
-
16.5%
]
16.15%
65,0421.5%
[
17.5%
-
18.0%
]
17.77%
39,8561.4%
[
18.0%
-
18.5%
]
18.08%
12,9281.6%
[
18.5%
-
19.0%
]
18.89%
16,8042.5%
[
20.0%
-
20.5%
]
20.21%
2,84516.1%
[
21.5%
-
22.0%
]
21.88%
16031.2%
[
22.5%
-
23.0%
]
22.98%
2,2241.1%
[
24.0%
-
24.5%
]
24.20%
36,8172.0%
[
25.0%
-
25.5%
]
25.49%
30,4191.7%
[
27.5%
-
28.0%
]
27.63%
4,0070.88%
[
28.5%
-
29.0%
]
28.72%
46,4671.7%
[
31.5%
-
32.0%
]
31.51%
7302.6%
[
40.5%
-
41.0%
]
40.53%
29,0270.18%
[
48.0%
-
48.5%
]
48.17%
1,4789.6%