Chickasaw Unemployment Among Women with Children Ages 6 to 17 years

COMPARE

Chickasaw
Race
Ancestry
AfghanAfricanAlaska NativeAlaskan AthabascanAlbanianAleutAlsatianAmericanApacheArabArapahoArgentineanArmenianAssyrian/Chaldean/SyriacAustralianAustrianBahamianBangladeshiBarbadianBasqueBelgianBelizeanBermudanBhutaneseBlackfeetBolivianBrazilianBritishBritish West IndianBulgarianBurmeseCajunCambodianCanadianCape VerdeanCarpatho RusynCelticCentral AmericanCentral American IndianCherokeeCheyenneChickasawChileanChineseChippewaChoctawColombianColvilleComancheCosta RicanCreeCreekCroatianCrowCubanCypriotCzechCzechoslovakianDanishDelawareDominicanDutchDutch West IndianEastern EuropeanEcuadorianEgyptianEnglishEstonianEthiopianEuropeanFijianFilipinoFinnishFrenchFrench American IndianFrench CanadianGermanGerman RussianGhanaianGreekGuamanian/ChamorroGuatemalanGuyaneseHaitianHmongHonduranHopiHoumaHungarianIcelanderIndian (Asian)IndonesianInupiatIranianIraqiIrishIroquoisIsraeliItalianJamaicanJapaneseJordanianKenyanKiowaKoreanLaotianLatvianLebaneseLiberianLithuanianLumbeeLuxembourgerMacedonianMalaysianMalteseMarshalleseMenomineeMexicanMexican American IndianMongolianMoroccanNative HawaiianNavajoNepaleseNew ZealanderNicaraguanNigerianNorthern EuropeanNorwegianOkinawanOsageOttawaPaiutePakistaniPalestinianPanamanianParaguayanPennsylvania GermanPeruvianPimaPolishPortuguesePotawatomiPuebloPuerto RicanPuget Sound SalishRomanianRussianSalvadoranSamoanScandinavianScotch-IrishScottishSeminoleSenegaleseSerbianShoshoneSierra LeoneanSiouxSlavicSlovakSloveneSomaliSouth AfricanSouth AmericanSouth American IndianSoviet UnionSpaniardSpanishSpanish AmericanSpanish American IndianSri LankanSubsaharan AfricanSudaneseSwedishSwissSyrianTaiwaneseThaiTlingit-HaidaTohono O'OdhamTonganTrinidadian and TobagonianTsimshianTurkishU.S. Virgin IslanderUgandanUkrainianUruguayanUteVenezuelanVietnameseWelshWest IndianYakamaYaquiYugoslavianYumanYup'ikZimbabwean
Immigration
NonimmigrantsImmigrantsAfghanistanAfricaAlbaniaArgentinaArmeniaAsiaAustraliaAustriaBahamasBangladeshBarbadosBelarusBelgiumBelizeBoliviaBosnia and HerzegovinaBrazilBulgariaBurma/MyanmarCabo VerdeCambodiaCameroonCanadaCaribbeanCentral AmericaChileChinaColombiaCongoCosta RicaCroatiaCubaCzechoslovakiaDenmarkDominicaDominican RepublicEastern AfricaEastern AsiaEastern EuropeEcuadorEgyptEl SalvadorEnglandEritreaEthiopiaEuropeFijiFranceGermanyGhanaGreeceGrenadaGuatemalaGuyanaHaitiHondurasHong KongHungaryIndiaIndonesiaIranIraqIrelandIsraelItalyJamaicaJapanJordanKazakhstanKenyaKoreaKuwaitLaosLatin AmericaLatviaLebanonLiberiaLithuaniaMalaysiaMexicoMicronesiaMiddle AfricaMoldovaMoroccoNepalNetherlandsNicaraguaNigeriaNorth AmericaNorth MacedoniaNorthern AfricaNorthern EuropeNorwayOceaniaPakistanPanamaPeruPhilippinesPolandPortugalRomaniaRussiaSaudi ArabiaScotlandSenegalSerbiaSierra LeoneSingaporeSomaliaSouth AfricaSouth AmericaSouth Central AsiaSouth Eastern AsiaSouthern EuropeSpainSri LankaSt. Vincent and the GrenadinesSudanSwedenSwitzerlandSyriaTaiwanThailandTrinidad and TobagoTurkeyUgandaUkraineUruguayUzbekistanVenezuelaVietnamWest IndiesWestern AfricaWestern AsiaWestern EuropeYemenZaireZimbabweAzores
Select to Compare
Race
Ancestry
AfghanAfricanAlaska NativeAlaskan AthabascanAlbanianAleutAlsatianAmericanApacheArabArapahoArgentineanArmenianAssyrian/Chaldean/SyriacAustralianAustrianBahamianBangladeshiBarbadianBasqueBelgianBelizeanBermudanBhutaneseBlackfeetBolivianBrazilianBritishBritish West IndianBulgarianBurmeseCajunCambodianCanadianCape VerdeanCarpatho RusynCelticCentral AmericanCentral American IndianCherokeeCheyenneChileanChineseChippewaChoctawColombianColvilleComancheCosta RicanCreeCreekCroatianCrowCubanCypriotCzechCzechoslovakianDanishDelawareDominicanDutchDutch West IndianEastern EuropeanEcuadorianEgyptianEnglishEstonianEthiopianEuropeanFijianFilipinoFinnishFrenchFrench American IndianFrench CanadianGermanGerman RussianGhanaianGreekGuamanian/ChamorroGuatemalanGuyaneseHaitianHmongHonduranHopiHoumaHungarianIcelanderIndian (Asian)IndonesianInupiatIranianIraqiIrishIroquoisIsraeliItalianJamaicanJapaneseJordanianKenyanKiowaKoreanLaotianLatvianLebaneseLiberianLithuanianLumbeeLuxembourgerMacedonianMalaysianMalteseMarshalleseMenomineeMexicanMexican American IndianMongolianMoroccanNative HawaiianNavajoNepaleseNew ZealanderNicaraguanNigerianNorthern EuropeanNorwegianOkinawanOsageOttawaPaiutePakistaniPalestinianPanamanianParaguayanPennsylvania GermanPeruvianPimaPolishPortuguesePotawatomiPuebloPuerto RicanPuget Sound SalishRomanianRussianSalvadoranSamoanScandinavianScotch-IrishScottishSeminoleSenegaleseSerbianShoshoneSierra LeoneanSiouxSlavicSlovakSloveneSomaliSouth AfricanSouth AmericanSouth American IndianSoviet UnionSpaniardSpanishSpanish AmericanSpanish American IndianSri LankanSubsaharan AfricanSudaneseSwedishSwissSyrianTaiwaneseThaiTlingit-HaidaTohono O'OdhamTonganTrinidadian and TobagonianTsimshianTurkishU.S. Virgin IslanderUgandanUkrainianUruguayanUteVenezuelanVietnameseWelshWest IndianYakamaYaquiYugoslavianYumanYup'ikZimbabwean
Immigration
NonimmigrantsImmigrantsAfghanistanAfricaAlbaniaArgentinaArmeniaAsiaAustraliaAustriaBahamasBangladeshBarbadosBelarusBelgiumBelizeBoliviaBosnia and HerzegovinaBrazilBulgariaBurma/MyanmarCabo VerdeCambodiaCameroonCanadaCaribbeanCentral AmericaChileChinaColombiaCongoCosta RicaCroatiaCubaCzechoslovakiaDenmarkDominicaDominican RepublicEastern AfricaEastern AsiaEastern EuropeEcuadorEgyptEl SalvadorEnglandEritreaEthiopiaEuropeFijiFranceGermanyGhanaGreeceGrenadaGuatemalaGuyanaHaitiHondurasHong KongHungaryIndiaIndonesiaIranIraqIrelandIsraelItalyJamaicaJapanJordanKazakhstanKenyaKoreaKuwaitLaosLatin AmericaLatviaLebanonLiberiaLithuaniaMalaysiaMexicoMicronesiaMiddle AfricaMoldovaMoroccoNepalNetherlandsNicaraguaNigeriaNorth AmericaNorth MacedoniaNorthern AfricaNorthern EuropeNorwayOceaniaPakistanPanamaPeruPhilippinesPolandPortugalRomaniaRussiaSaudi ArabiaScotlandSenegalSerbiaSierra LeoneSingaporeSomaliaSouth AfricaSouth AmericaSouth Central AsiaSouth Eastern AsiaSouthern EuropeSpainSri LankaSt. Vincent and the GrenadinesSudanSwedenSwitzerlandSyriaTaiwanThailandTrinidad and TobagoTurkeyUgandaUkraineUruguayUzbekistanVenezuelaVietnamWest IndiesWestern AfricaWestern AsiaWestern EuropeYemenZaireZimbabweAzores
Unemployment Among Women with Children Ages 6 to 17 years
Income
Poverty
Unemployment
Labor Participation
Family Structure
Vehicle Availability
Education Level
Disability

Chickasaw Unemployment Among Women with Children Ages 6 to 17 years
Exceptional

8.6%
UNEMPLOYMENT | WOMEN W/ CHILDREN 6 TO 17
97.6/ 100
METRIC RATING
107th/ 347
METRIC RANK

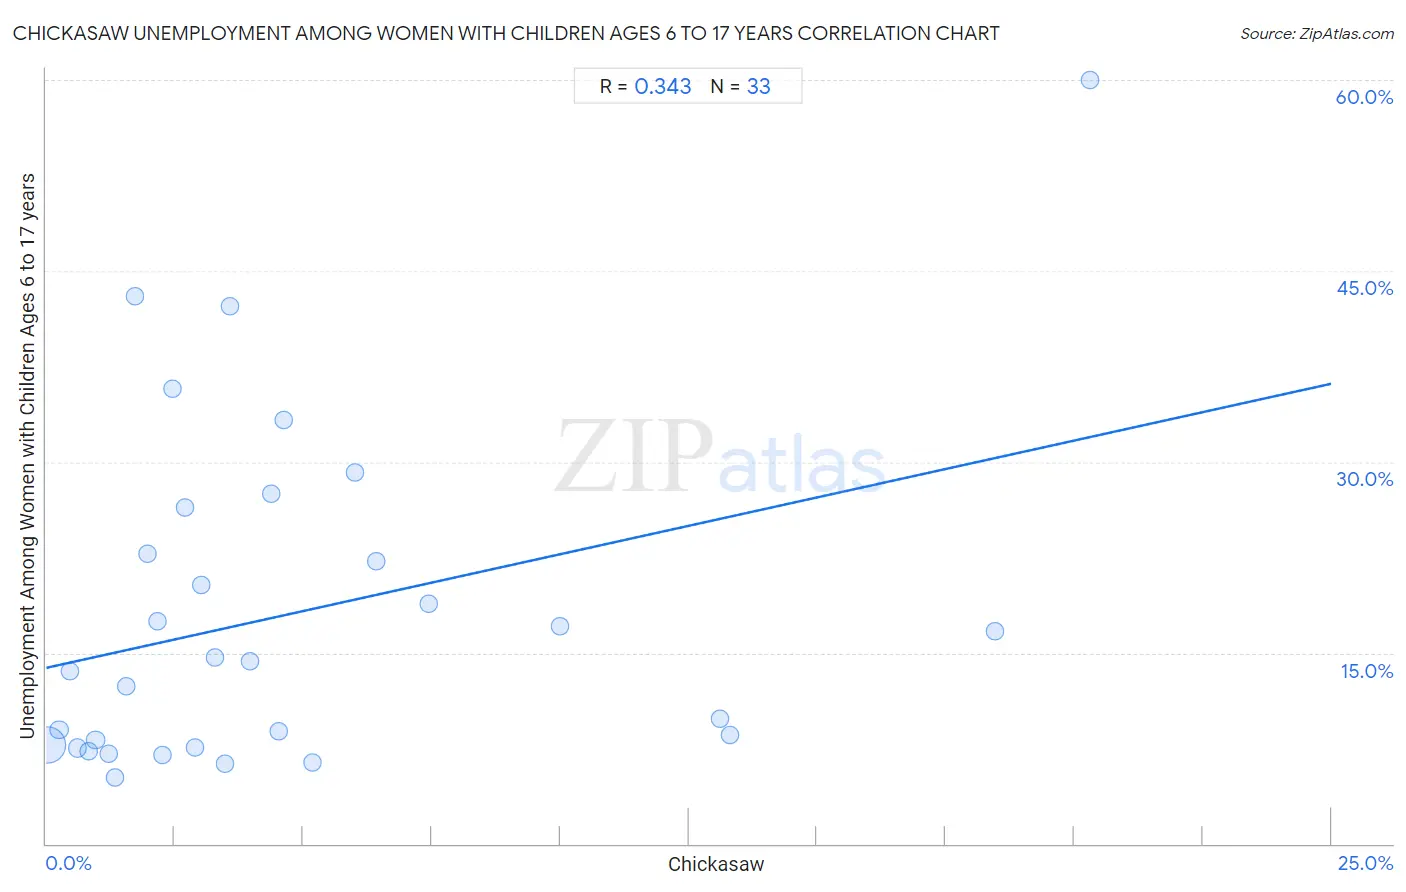
Chickasaw Unemployment Among Women with Children Ages 6 to 17 years Correlation Chart

The statistical analysis conducted on geographies consisting of 124,393,845 people shows a mild positive correlation between the proportion of Chickasaw and unemployment rate among women with children between the ages 6 and 17 in the United States with a correlation coefficient (R) of 0.343 and weighted average of 8.6%. On average, for every 1% (one percent) increase in Chickasaw within a typical geography, there is an increase of 0.89% in unemployment rate among women with children between the ages 6 and 17.
Chickasaw Unemployment Among Women with Children Ages 6 to 17 years
It is essential to understand that the correlation between the percentage of Chickasaw and unemployment rate among women with children between the ages 6 and 17 does not imply a direct cause-and-effect relationship. It remains uncertain whether the presence of Chickasaw influences an upward or downward trend in the level of unemployment rate among women with children between the ages 6 and 17 within an area, or if Chickasaw simply ended up residing in those areas with higher or lower levels of unemployment rate among women with children between the ages 6 and 17 due to other factors.

Demographics Similar to Chickasaw by Unemployment Among Women with Children Ages 6 to 17 years

In terms of unemployment among women with children ages 6 to 17 years, the demographic groups most similar to Chickasaw are Swedish (8.6%, a difference of 0.010%), Immigrants from Serbia (8.6%, a difference of 0.030%), Immigrants from Norway (8.6%, a difference of 0.070%), Immigrants from Romania (8.6%, a difference of 0.080%), and Latvian (8.6%, a difference of 0.090%).
DemographicsRating | RankUnemployment Among Women with Children Ages 6 to 17 years
New Zealanders
98.4
/100
|
#100
Exceptional
8.6%
Immigrants from Pakistan
98.4
/100
|
#101
Exceptional
8.6%
Immigrants from South Africa
98.3
/100
|
#102
Exceptional
8.6%
Scandinavians
98.3
/100
|
#103
Exceptional
8.6%
Immigrants from France
98.0
/100
|
#104
Exceptional
8.6%
Immigrants from Norway
97.8
/100
|
#105
Exceptional
8.6%
Immigrants from Serbia
97.7
/100
|
#106
Exceptional
8.6%
Chickasaw
97.6
/100
|
#107
Exceptional
8.6%
Swedes
97.6
/100
|
#108
Exceptional
8.6%
Immigrants from Romania
97.5
/100
|
#109
Exceptional
8.6%
Latvians
97.4
/100
|
#110
Exceptional
8.6%
Immigrants from Ukraine
97.4
/100
|
#111
Exceptional
8.6%
Romanians
97.1
/100
|
#112
Exceptional
8.6%
Eastern Europeans
96.8
/100
|
#113
Exceptional
8.6%
Immigrants from Russia
96.7
/100
|
#114
Exceptional
8.6%

Chickasaw Unemployment Among Women with Children Ages 6 to 17 years Correlation Summary

MeasurementChickasaw DataUnemployment Among Women with Children Ages 6 to 17 years Data
Minimum0.028%5.2%
Maximum20.3%60.0%
Range20.3%54.8%
Mean4.7%18.0%
Median3.0%14.3%
Interquartile 25% (IQ1)1.4%7.6%
Interquartile 75% (IQ3)5.6%24.6%
Interquartile Range (IQR)4.1%17.0%
Standard Deviation (Sample)5.0%13.1%
Standard Deviation (Population)4.9%12.9%

Correlation Details

Chickasaw PercentileSample SizeUnemployment Among Women with Children Ages 6 to 17 years
[
0.0%
-
0.5%
]
0.028%
118,088,8547.8%
[
0.0%
-
0.5%
]
0.25%
2,957,5849.0%
[
0.0%
-
0.5%
]
0.45%
690,78913.5%
[
0.5%
-
1.0%
]
0.60%
1,240,3097.5%
[
0.5%
-
1.0%
]
0.83%
615,8117.3%
[
0.5%
-
1.0%
]
0.96%
306,3498.1%
[
1.0%
-
1.5%
]
1.22%
125,8877.1%
[
1.0%
-
1.5%
]
1.33%
116,9205.2%
[
1.5%
-
2.0%
]
1.55%
45,03412.3%
[
1.5%
-
2.0%
]
1.73%
6,81543.0%
[
1.5%
-
2.0%
]
1.96%
7,43622.8%
[
2.0%
-
2.5%
]
2.16%
16,26117.5%
[
2.0%
-
2.5%
]
2.25%
7,7297.0%
[
2.0%
-
2.5%
]
2.46%
3,12435.7%
[
2.5%
-
3.0%
]
2.70%
4,62326.4%
[
2.5%
-
3.0%
]
2.90%
51,7697.5%
[
3.0%
-
3.5%
]
3.02%
7,08020.3%
[
3.0%
-
3.5%
]
3.29%
3,64914.6%
[
3.0%
-
3.5%
]
3.48%
5,8126.3%
[
3.5%
-
4.0%
]
3.56%
1,23542.2%
[
3.5%
-
4.0%
]
3.96%
1,16314.3%
[
4.0%
-
4.5%
]
4.38%
11,73227.5%
[
4.5%
-
5.0%
]
4.54%
24,7848.8%
[
4.5%
-
5.0%
]
4.61%
56433.3%
[
5.0%
-
5.5%
]
5.17%
36,3246.4%
[
5.5%
-
6.0%
]
6.00%
1,76729.2%
[
6.0%
-
6.5%
]
6.41%
46822.2%
[
7.0%
-
7.5%
]
7.44%
1,97618.9%
[
9.5%
-
10.0%
]
9.99%
1,68117.1%
[
13.0%
-
13.5%
]
13.11%
6,7149.8%
[
13.0%
-
13.5%
]
13.31%
3,1108.5%
[
18.0%
-
18.5%
]
18.46%
42816.7%
[
20.0%
-
20.5%
]
20.31%
6460.0%