Immigrants from Serbia Disability Age Under 5

COMPARE

Immigrants from Serbia
Race
Ancestry
AfghanAfricanAlaska NativeAlaskan AthabascanAlbanianAleutAlsatianAmericanApacheArabArapahoArgentineanArmenianAssyrian/Chaldean/SyriacAustralianAustrianBahamianBangladeshiBarbadianBasqueBelgianBelizeanBermudanBhutaneseBlackfeetBolivianBrazilianBritishBritish West IndianBulgarianBurmeseCajunCambodianCanadianCape VerdeanCarpatho RusynCelticCentral AmericanCentral American IndianCherokeeCheyenneChickasawChileanChineseChippewaChoctawColombianColvilleComancheCosta RicanCreeCreekCroatianCrowCubanCypriotCzechCzechoslovakianDanishDelawareDominicanDutchDutch West IndianEastern EuropeanEcuadorianEgyptianEnglishEstonianEthiopianEuropeanFijianFilipinoFinnishFrenchFrench American IndianFrench CanadianGermanGerman RussianGhanaianGreekGuamanian/ChamorroGuatemalanGuyaneseHaitianHmongHonduranHopiHoumaHungarianIcelanderIndian (Asian)IndonesianInupiatIranianIraqiIrishIroquoisIsraeliItalianJamaicanJapaneseJordanianKenyanKiowaKoreanLaotianLatvianLebaneseLiberianLithuanianLumbeeLuxembourgerMacedonianMalaysianMalteseMarshalleseMenomineeMexicanMexican American IndianMongolianMoroccanNative HawaiianNavajoNepaleseNew ZealanderNicaraguanNigerianNorthern EuropeanNorwegianOkinawanOsageOttawaPaiutePakistaniPalestinianPanamanianParaguayanPennsylvania GermanPeruvianPimaPolishPortuguesePotawatomiPuebloPuerto RicanPuget Sound SalishRomanianRussianSalvadoranSamoanScandinavianScotch-IrishScottishSeminoleSenegaleseSerbianShoshoneSierra LeoneanSiouxSlavicSlovakSloveneSomaliSouth AfricanSouth AmericanSouth American IndianSoviet UnionSpaniardSpanishSpanish AmericanSpanish American IndianSri LankanSubsaharan AfricanSudaneseSwedishSwissSyrianTaiwaneseThaiTlingit-HaidaTohono O'OdhamTonganTrinidadian and TobagonianTsimshianTurkishU.S. Virgin IslanderUgandanUkrainianUruguayanUteVenezuelanVietnameseWelshWest IndianYakamaYaquiYugoslavianYumanYup'ikZimbabwean
Immigration
NonimmigrantsImmigrantsAfghanistanAfricaAlbaniaArgentinaArmeniaAsiaAustraliaAustriaBahamasBangladeshBarbadosBelarusBelgiumBelizeBoliviaBosnia and HerzegovinaBrazilBulgariaBurma/MyanmarCabo VerdeCambodiaCameroonCanadaCaribbeanCentral AmericaChileChinaColombiaCongoCosta RicaCroatiaCubaCzechoslovakiaDenmarkDominicaDominican RepublicEastern AfricaEastern AsiaEastern EuropeEcuadorEgyptEl SalvadorEnglandEritreaEthiopiaEuropeFijiFranceGermanyGhanaGreeceGrenadaGuatemalaGuyanaHaitiHondurasHong KongHungaryIndiaIndonesiaIranIraqIrelandIsraelItalyJamaicaJapanJordanKazakhstanKenyaKoreaKuwaitLaosLatin AmericaLatviaLebanonLiberiaLithuaniaMalaysiaMexicoMicronesiaMiddle AfricaMoldovaMoroccoNepalNetherlandsNicaraguaNigeriaNorth AmericaNorth MacedoniaNorthern AfricaNorthern EuropeNorwayOceaniaPakistanPanamaPeruPhilippinesPolandPortugalRomaniaRussiaSaudi ArabiaScotlandSenegalSerbiaSierra LeoneSingaporeSomaliaSouth AfricaSouth AmericaSouth Central AsiaSouth Eastern AsiaSouthern EuropeSpainSri LankaSt. Vincent and the GrenadinesSudanSwedenSwitzerlandSyriaTaiwanThailandTrinidad and TobagoTurkeyUgandaUkraineUruguayUzbekistanVenezuelaVietnamWest IndiesWestern AfricaWestern AsiaWestern EuropeYemenZaireZimbabweAzores
Select to Compare
Race
Ancestry
AfghanAfricanAlaska NativeAlaskan AthabascanAlbanianAleutAlsatianAmericanApacheArabArapahoArgentineanArmenianAssyrian/Chaldean/SyriacAustralianAustrianBahamianBangladeshiBarbadianBasqueBelgianBelizeanBermudanBhutaneseBlackfeetBolivianBrazilianBritishBritish West IndianBulgarianBurmeseCajunCambodianCanadianCape VerdeanCarpatho RusynCelticCentral AmericanCentral American IndianCherokeeCheyenneChickasawChileanChineseChippewaChoctawColombianColvilleComancheCosta RicanCreeCreekCroatianCrowCubanCypriotCzechCzechoslovakianDanishDelawareDominicanDutchDutch West IndianEastern EuropeanEcuadorianEgyptianEnglishEstonianEthiopianEuropeanFijianFilipinoFinnishFrenchFrench American IndianFrench CanadianGermanGerman RussianGhanaianGreekGuamanian/ChamorroGuatemalanGuyaneseHaitianHmongHonduranHopiHoumaHungarianIcelanderIndian (Asian)IndonesianInupiatIranianIraqiIrishIroquoisIsraeliItalianJamaicanJapaneseJordanianKenyanKiowaKoreanLaotianLatvianLebaneseLiberianLithuanianLumbeeLuxembourgerMacedonianMalaysianMalteseMarshalleseMenomineeMexicanMexican American IndianMongolianMoroccanNative HawaiianNavajoNepaleseNew ZealanderNicaraguanNigerianNorthern EuropeanNorwegianOkinawanOsageOttawaPaiutePakistaniPalestinianPanamanianParaguayanPennsylvania GermanPeruvianPimaPolishPortuguesePotawatomiPuebloPuerto RicanPuget Sound SalishRomanianRussianSalvadoranSamoanScandinavianScotch-IrishScottishSeminoleSenegaleseSerbianShoshoneSierra LeoneanSiouxSlavicSlovakSloveneSomaliSouth AfricanSouth AmericanSouth American IndianSoviet UnionSpaniardSpanishSpanish AmericanSpanish American IndianSri LankanSubsaharan AfricanSudaneseSwedishSwissSyrianTaiwaneseThaiTlingit-HaidaTohono O'OdhamTonganTrinidadian and TobagonianTsimshianTurkishU.S. Virgin IslanderUgandanUkrainianUruguayanUteVenezuelanVietnameseWelshWest IndianYakamaYaquiYugoslavianYumanYup'ikZimbabwean
Immigration
NonimmigrantsImmigrantsAfghanistanAfricaAlbaniaArgentinaArmeniaAsiaAustraliaAustriaBahamasBangladeshBarbadosBelarusBelgiumBelizeBoliviaBosnia and HerzegovinaBrazilBulgariaBurma/MyanmarCabo VerdeCambodiaCameroonCanadaCaribbeanCentral AmericaChileChinaColombiaCongoCosta RicaCroatiaCubaCzechoslovakiaDenmarkDominicaDominican RepublicEastern AfricaEastern AsiaEastern EuropeEcuadorEgyptEl SalvadorEnglandEritreaEthiopiaEuropeFijiFranceGermanyGhanaGreeceGrenadaGuatemalaGuyanaHaitiHondurasHong KongHungaryIndiaIndonesiaIranIraqIrelandIsraelItalyJamaicaJapanJordanKazakhstanKenyaKoreaKuwaitLaosLatin AmericaLatviaLebanonLiberiaLithuaniaMalaysiaMexicoMicronesiaMiddle AfricaMoldovaMoroccoNepalNetherlandsNicaraguaNigeriaNorth AmericaNorth MacedoniaNorthern AfricaNorthern EuropeNorwayOceaniaPakistanPanamaPeruPhilippinesPolandPortugalRomaniaRussiaSaudi ArabiaScotlandSenegalSierra LeoneSingaporeSomaliaSouth AfricaSouth AmericaSouth Central AsiaSouth Eastern AsiaSouthern EuropeSpainSri LankaSt. Vincent and the GrenadinesSudanSwedenSwitzerlandSyriaTaiwanThailandTrinidad and TobagoTurkeyUgandaUkraineUruguayUzbekistanVenezuelaVietnamWest IndiesWestern AfricaWestern AsiaWestern EuropeYemenZaireZimbabweAzores
Disability Age Under 5
Income
Poverty
Unemployment
Labor Participation
Family Structure
Vehicle Availability
Education Level
Disability

Immigrants from Serbia Disability Age Under 5
Excellent

1.2%
DISABILITY | AGE UNDER 5
87.6/ 100
METRIC RATING
131st/ 347
METRIC RANK

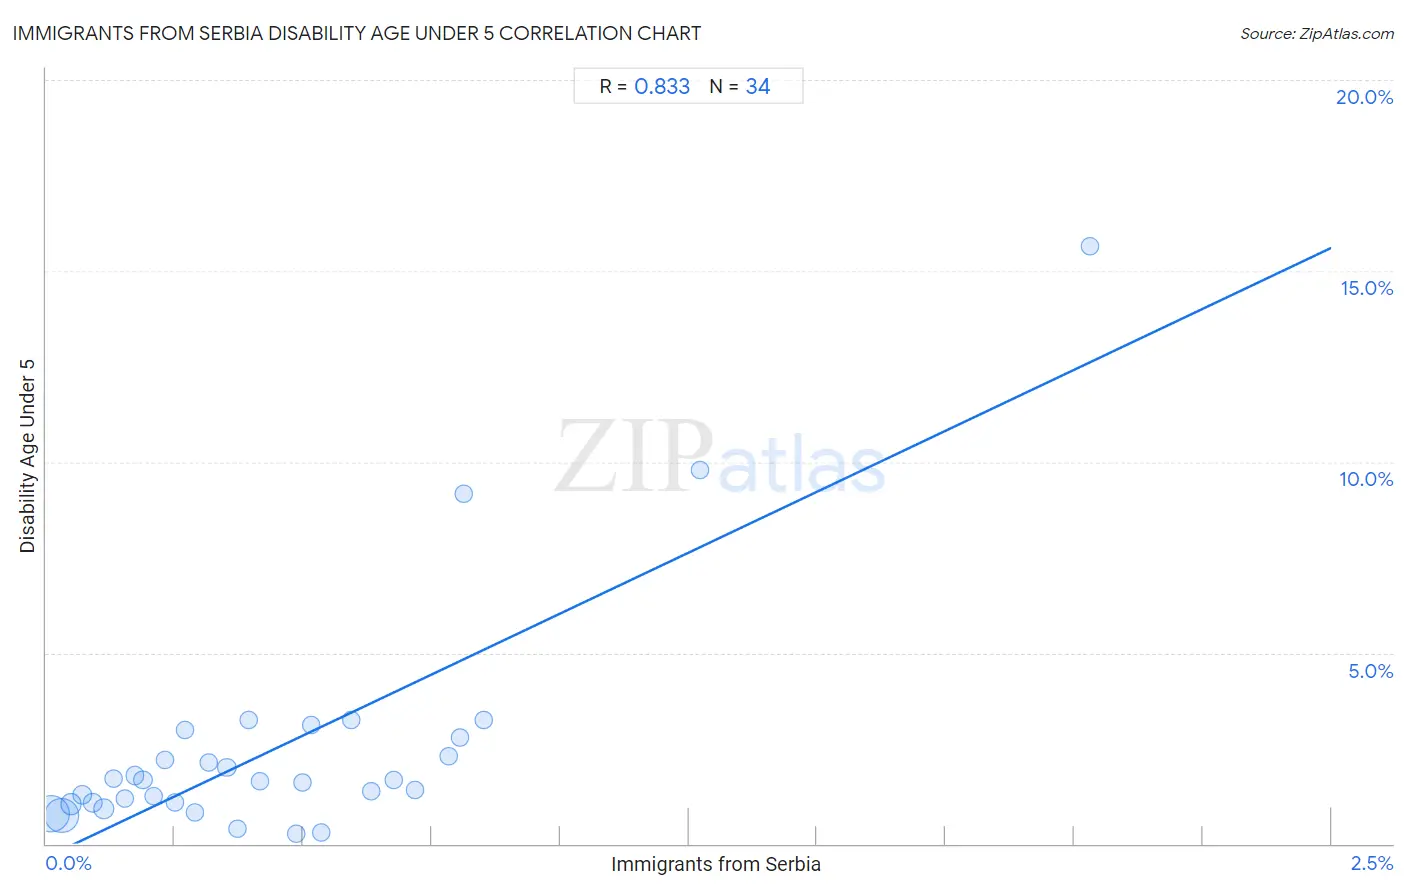
Immigrants from Serbia Disability Age Under 5 Correlation Chart

The statistical analysis conducted on geographies consisting of 93,075,533 people shows a very strong positive correlation between the proportion of Immigrants from Serbia and percentage of population with a disability under the age of 5 in the United States with a correlation coefficient (R) of 0.833 and weighted average of 1.2%. On average, for every 1% (one percent) increase in Immigrants from Serbia within a typical geography, there is an increase of 6.4% in percentage of population with a disability under the age of 5.
Immigrants from Serbia Disability Age Under 5
It is essential to understand that the correlation between the percentage of Immigrants from Serbia and percentage of population with a disability under the age of 5 does not imply a direct cause-and-effect relationship. It remains uncertain whether the presence of Immigrants from Serbia influences an upward or downward trend in the level of percentage of population with a disability under the age of 5 within an area, or if Immigrants from Serbia simply ended up residing in those areas with higher or lower levels of percentage of population with a disability under the age of 5 due to other factors.

Demographics Similar to Immigrants from Serbia by Disability Age Under 5

In terms of disability age under 5, the demographic groups most similar to Immigrants from Serbia are Korean (1.2%, a difference of 0.020%), Immigrants from Eastern Europe (1.2%, a difference of 0.070%), Immigrants (1.2%, a difference of 0.090%), Immigrants from Romania (1.2%, a difference of 0.19%), and Immigrants from France (1.2%, a difference of 0.19%).
DemographicsRating | RankDisability Age Under 5
Immigrants from Cambodia
90.5
/100
|
#124
Exceptional
1.2%
Japanese
90.3
/100
|
#125
Exceptional
1.2%
Central Americans
89.7
/100
|
#126
Excellent
1.2%
Immigrants from Romania
88.4
/100
|
#127
Excellent
1.2%
Immigrants from France
88.4
/100
|
#128
Excellent
1.2%
Immigrants
88.0
/100
|
#129
Excellent
1.2%
Koreans
87.7
/100
|
#130
Excellent
1.2%
Immigrants from Serbia
87.6
/100
|
#131
Excellent
1.2%
Immigrants from Eastern Europe
87.3
/100
|
#132
Excellent
1.2%
Immigrants from Spain
86.5
/100
|
#133
Excellent
1.2%
Argentineans
85.7
/100
|
#134
Excellent
1.2%
Fijians
84.7
/100
|
#135
Excellent
1.2%
Moroccans
83.6
/100
|
#136
Excellent
1.2%
Immigrants from Eastern Africa
83.1
/100
|
#137
Excellent
1.2%
Immigrants from Czechoslovakia
82.8
/100
|
#138
Excellent
1.2%

Immigrants from Serbia Disability Age Under 5 Correlation Summary

MeasurementImmigrants from Serbia DataDisability Age Under 5 Data
Minimum0.0095%0.28%
Maximum2.0%15.7%
Range2.0%15.4%
Mean0.45%2.5%
Median0.36%1.6%
Interquartile 25% (IQ1)0.17%1.1%
Interquartile 75% (IQ3)0.63%2.8%
Interquartile Range (IQR)0.46%1.7%
Standard Deviation (Sample)0.40%3.1%
Standard Deviation (Population)0.40%3.1%

Correlation Details

Immigrants from Serbia PercentileSample SizeDisability Age Under 5
[
0.0%
-
0.5%
]
0.0095%
39,396,4500.80%
[
0.0%
-
0.5%
]
0.030%
32,272,7690.74%
[
0.0%
-
0.5%
]
0.049%
6,269,1631.0%
[
0.0%
-
0.5%
]
0.070%
3,462,5761.3%
[
0.0%
-
0.5%
]
0.090%
1,547,5021.1%
[
0.0%
-
0.5%
]
0.11%
5,024,5320.91%
[
0.0%
-
0.5%
]
0.13%
686,0621.7%
[
0.0%
-
0.5%
]
0.15%
877,3671.2%
[
0.0%
-
0.5%
]
0.17%
431,0101.8%
[
0.0%
-
0.5%
]
0.19%
655,6111.7%
[
0.0%
-
0.5%
]
0.21%
442,5181.2%
[
0.0%
-
0.5%
]
0.23%
226,4062.2%
[
0.0%
-
0.5%
]
0.25%
262,8891.1%
[
0.0%
-
0.5%
]
0.27%
104,7883.0%
[
0.0%
-
0.5%
]
0.29%
233,2860.81%
[
0.0%
-
0.5%
]
0.32%
55,3902.1%
[
0.0%
-
0.5%
]
0.35%
238,2562.0%
[
0.0%
-
0.5%
]
0.37%
90,9560.40%
[
0.0%
-
0.5%
]
0.39%
133,7673.2%
[
0.0%
-
0.5%
]
0.41%
94,2401.6%
[
0.0%
-
0.5%
]
0.49%
80,2960.28%
[
0.0%
-
0.5%
]
0.50%
34,6351.6%
[
0.5%
-
1.0%
]
0.52%
24,0483.1%
[
0.5%
-
1.0%
]
0.53%
105,5210.28%
[
0.5%
-
1.0%
]
0.59%
79,9703.2%
[
0.5%
-
1.0%
]
0.63%
68,8671.4%
[
0.5%
-
1.0%
]
0.68%
23,6761.7%
[
0.5%
-
1.0%
]
0.72%
24,2331.4%
[
0.5%
-
1.0%
]
0.78%
61,4942.3%
[
0.5%
-
1.0%
]
0.80%
15,2912.8%
[
0.5%
-
1.0%
]
0.81%
2,3369.2%
[
0.5%
-
1.0%
]
0.85%
38,7153.2%
[
1.0%
-
1.5%
]
1.27%
9,9779.8%
[
2.0%
-
2.5%
]
2.03%
93615.7%