Sierra Leonean Disability Age Under 5

COMPARE

Sierra Leonean
Race
Ancestry
AfghanAfricanAlaska NativeAlaskan AthabascanAlbanianAleutAlsatianAmericanApacheArabArapahoArgentineanArmenianAssyrian/Chaldean/SyriacAustralianAustrianBahamianBangladeshiBarbadianBasqueBelgianBelizeanBermudanBhutaneseBlackfeetBolivianBrazilianBritishBritish West IndianBulgarianBurmeseCajunCambodianCanadianCape VerdeanCarpatho RusynCelticCentral AmericanCentral American IndianCherokeeCheyenneChickasawChileanChineseChippewaChoctawColombianColvilleComancheCosta RicanCreeCreekCroatianCrowCubanCypriotCzechCzechoslovakianDanishDelawareDominicanDutchDutch West IndianEastern EuropeanEcuadorianEgyptianEnglishEstonianEthiopianEuropeanFijianFilipinoFinnishFrenchFrench American IndianFrench CanadianGermanGerman RussianGhanaianGreekGuamanian/ChamorroGuatemalanGuyaneseHaitianHmongHonduranHopiHoumaHungarianIcelanderIndian (Asian)IndonesianInupiatIranianIraqiIrishIroquoisIsraeliItalianJamaicanJapaneseJordanianKenyanKiowaKoreanLaotianLatvianLebaneseLiberianLithuanianLumbeeLuxembourgerMacedonianMalaysianMalteseMarshalleseMenomineeMexicanMexican American IndianMongolianMoroccanNative HawaiianNavajoNepaleseNew ZealanderNicaraguanNigerianNorthern EuropeanNorwegianOkinawanOsageOttawaPaiutePakistaniPalestinianPanamanianParaguayanPennsylvania GermanPeruvianPimaPolishPortuguesePotawatomiPuebloPuerto RicanPuget Sound SalishRomanianRussianSalvadoranSamoanScandinavianScotch-IrishScottishSeminoleSenegaleseSerbianShoshoneSierra LeoneanSiouxSlavicSlovakSloveneSomaliSouth AfricanSouth AmericanSouth American IndianSoviet UnionSpaniardSpanishSpanish AmericanSpanish American IndianSri LankanSubsaharan AfricanSudaneseSwedishSwissSyrianTaiwaneseThaiTlingit-HaidaTohono O'OdhamTonganTrinidadian and TobagonianTsimshianTurkishU.S. Virgin IslanderUgandanUkrainianUruguayanUteVenezuelanVietnameseWelshWest IndianYakamaYaquiYugoslavianYumanYup'ikZimbabwean
Immigration
NonimmigrantsImmigrantsAfghanistanAfricaAlbaniaArgentinaArmeniaAsiaAustraliaAustriaBahamasBangladeshBarbadosBelarusBelgiumBelizeBoliviaBosnia and HerzegovinaBrazilBulgariaBurma/MyanmarCabo VerdeCambodiaCameroonCanadaCaribbeanCentral AmericaChileChinaColombiaCongoCosta RicaCroatiaCubaCzechoslovakiaDenmarkDominicaDominican RepublicEastern AfricaEastern AsiaEastern EuropeEcuadorEgyptEl SalvadorEnglandEritreaEthiopiaEuropeFijiFranceGermanyGhanaGreeceGrenadaGuatemalaGuyanaHaitiHondurasHong KongHungaryIndiaIndonesiaIranIraqIrelandIsraelItalyJamaicaJapanJordanKazakhstanKenyaKoreaKuwaitLaosLatin AmericaLatviaLebanonLiberiaLithuaniaMalaysiaMexicoMicronesiaMiddle AfricaMoldovaMoroccoNepalNetherlandsNicaraguaNigeriaNorth AmericaNorth MacedoniaNorthern AfricaNorthern EuropeNorwayOceaniaPakistanPanamaPeruPhilippinesPolandPortugalRomaniaRussiaSaudi ArabiaScotlandSenegalSerbiaSierra LeoneSingaporeSomaliaSouth AfricaSouth AmericaSouth Central AsiaSouth Eastern AsiaSouthern EuropeSpainSri LankaSt. Vincent and the GrenadinesSudanSwedenSwitzerlandSyriaTaiwanThailandTrinidad and TobagoTurkeyUgandaUkraineUruguayUzbekistanVenezuelaVietnamWest IndiesWestern AfricaWestern AsiaWestern EuropeYemenZaireZimbabweAzores
Select to Compare
Race
Ancestry
AfghanAfricanAlaska NativeAlaskan AthabascanAlbanianAleutAlsatianAmericanApacheArabArapahoArgentineanArmenianAssyrian/Chaldean/SyriacAustralianAustrianBahamianBangladeshiBarbadianBasqueBelgianBelizeanBermudanBhutaneseBlackfeetBolivianBrazilianBritishBritish West IndianBulgarianBurmeseCajunCambodianCanadianCape VerdeanCarpatho RusynCelticCentral AmericanCentral American IndianCherokeeCheyenneChickasawChileanChineseChippewaChoctawColombianColvilleComancheCosta RicanCreeCreekCroatianCrowCubanCypriotCzechCzechoslovakianDanishDelawareDominicanDutchDutch West IndianEastern EuropeanEcuadorianEgyptianEnglishEstonianEthiopianEuropeanFijianFilipinoFinnishFrenchFrench American IndianFrench CanadianGermanGerman RussianGhanaianGreekGuamanian/ChamorroGuatemalanGuyaneseHaitianHmongHonduranHopiHoumaHungarianIcelanderIndian (Asian)IndonesianInupiatIranianIraqiIrishIroquoisIsraeliItalianJamaicanJapaneseJordanianKenyanKiowaKoreanLaotianLatvianLebaneseLiberianLithuanianLumbeeLuxembourgerMacedonianMalaysianMalteseMarshalleseMenomineeMexicanMexican American IndianMongolianMoroccanNative HawaiianNavajoNepaleseNew ZealanderNicaraguanNigerianNorthern EuropeanNorwegianOkinawanOsageOttawaPaiutePakistaniPalestinianPanamanianParaguayanPennsylvania GermanPeruvianPimaPolishPortuguesePotawatomiPuebloPuerto RicanPuget Sound SalishRomanianRussianSalvadoranSamoanScandinavianScotch-IrishScottishSeminoleSenegaleseSerbianShoshoneSiouxSlavicSlovakSloveneSomaliSouth AfricanSouth AmericanSouth American IndianSoviet UnionSpaniardSpanishSpanish AmericanSpanish American IndianSri LankanSubsaharan AfricanSudaneseSwedishSwissSyrianTaiwaneseThaiTlingit-HaidaTohono O'OdhamTonganTrinidadian and TobagonianTsimshianTurkishU.S. Virgin IslanderUgandanUkrainianUruguayanUteVenezuelanVietnameseWelshWest IndianYakamaYaquiYugoslavianYumanYup'ikZimbabwean
Immigration
NonimmigrantsImmigrantsAfghanistanAfricaAlbaniaArgentinaArmeniaAsiaAustraliaAustriaBahamasBangladeshBarbadosBelarusBelgiumBelizeBoliviaBosnia and HerzegovinaBrazilBulgariaBurma/MyanmarCabo VerdeCambodiaCameroonCanadaCaribbeanCentral AmericaChileChinaColombiaCongoCosta RicaCroatiaCubaCzechoslovakiaDenmarkDominicaDominican RepublicEastern AfricaEastern AsiaEastern EuropeEcuadorEgyptEl SalvadorEnglandEritreaEthiopiaEuropeFijiFranceGermanyGhanaGreeceGrenadaGuatemalaGuyanaHaitiHondurasHong KongHungaryIndiaIndonesiaIranIraqIrelandIsraelItalyJamaicaJapanJordanKazakhstanKenyaKoreaKuwaitLaosLatin AmericaLatviaLebanonLiberiaLithuaniaMalaysiaMexicoMicronesiaMiddle AfricaMoldovaMoroccoNepalNetherlandsNicaraguaNigeriaNorth AmericaNorth MacedoniaNorthern AfricaNorthern EuropeNorwayOceaniaPakistanPanamaPeruPhilippinesPolandPortugalRomaniaRussiaSaudi ArabiaScotlandSenegalSerbiaSierra LeoneSingaporeSomaliaSouth AfricaSouth AmericaSouth Central AsiaSouth Eastern AsiaSouthern EuropeSpainSri LankaSt. Vincent and the GrenadinesSudanSwedenSwitzerlandSyriaTaiwanThailandTrinidad and TobagoTurkeyUgandaUkraineUruguayUzbekistanVenezuelaVietnamWest IndiesWestern AfricaWestern AsiaWestern EuropeYemenZaireZimbabweAzores
Disability Age Under 5
Income
Poverty
Unemployment
Labor Participation
Family Structure
Vehicle Availability
Education Level
Disability

Sierra Leonean Disability Age Under 5
Average

1.2%
DISABILITY | AGE UNDER 5
59.1/ 100
METRIC RATING
168th/ 347
METRIC RANK

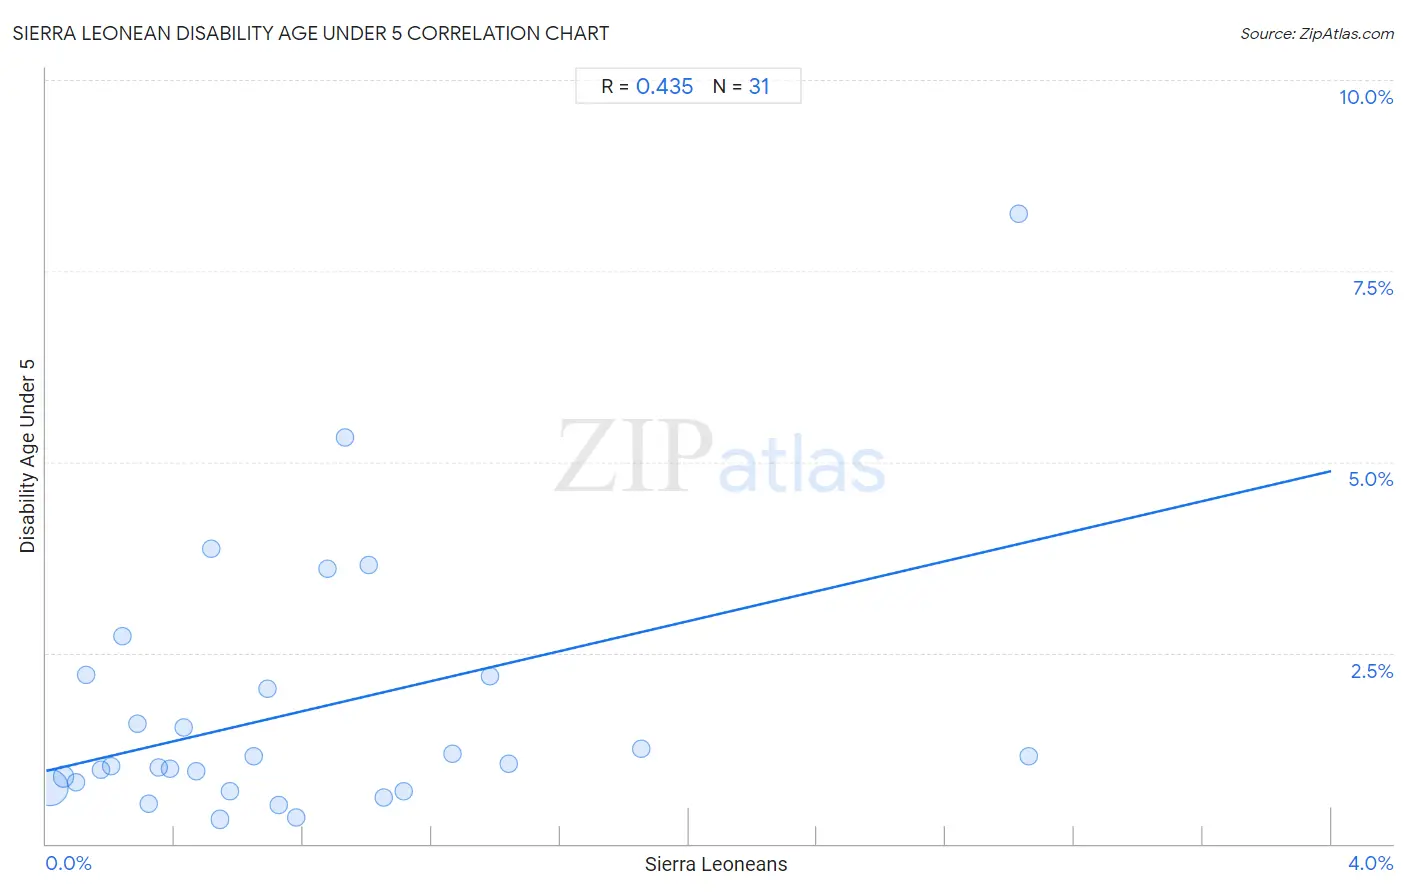
Sierra Leonean Disability Age Under 5 Correlation Chart

The statistical analysis conducted on geographies consisting of 65,429,167 people shows a moderate positive correlation between the proportion of Sierra Leoneans and percentage of population with a disability under the age of 5 in the United States with a correlation coefficient (R) of 0.435 and weighted average of 1.2%. On average, for every 1% (one percent) increase in Sierra Leoneans within a typical geography, there is an increase of 0.98% in percentage of population with a disability under the age of 5.
Sierra Leonean Disability Age Under 5
It is essential to understand that the correlation between the percentage of Sierra Leoneans and percentage of population with a disability under the age of 5 does not imply a direct cause-and-effect relationship. It remains uncertain whether the presence of Sierra Leoneans influences an upward or downward trend in the level of percentage of population with a disability under the age of 5 within an area, or if Sierra Leoneans simply ended up residing in those areas with higher or lower levels of percentage of population with a disability under the age of 5 due to other factors.

Demographics Similar to Sierra Leoneans by Disability Age Under 5

In terms of disability age under 5, the demographic groups most similar to Sierra Leoneans are Immigrants from Uruguay (1.2%, a difference of 0.010%), Immigrants from Jamaica (1.2%, a difference of 0.030%), Immigrants from Argentina (1.2%, a difference of 0.11%), Guamanian/Chamorro (1.2%, a difference of 0.12%), and Immigrants from Central America (1.2%, a difference of 0.22%).
DemographicsRating | RankDisability Age Under 5
Immigrants from Africa
65.1
/100
|
#161
Good
1.2%
Guatemalans
63.6
/100
|
#162
Good
1.2%
Immigrants from Guatemala
63.2
/100
|
#163
Good
1.2%
Laotians
62.8
/100
|
#164
Good
1.2%
Immigrants from Kuwait
62.6
/100
|
#165
Good
1.2%
Immigrants from Central America
61.4
/100
|
#166
Good
1.2%
Immigrants from Argentina
60.2
/100
|
#167
Good
1.2%
Sierra Leoneans
59.1
/100
|
#168
Average
1.2%
Immigrants from Uruguay
59.0
/100
|
#169
Average
1.2%
Immigrants from Jamaica
58.8
/100
|
#170
Average
1.2%
Guamanians/Chamorros
57.8
/100
|
#171
Average
1.2%
Crow
51.0
/100
|
#172
Average
1.2%
Immigrants from Ireland
50.3
/100
|
#173
Average
1.2%
Immigrants from Latvia
50.0
/100
|
#174
Average
1.2%
Immigrants from Nigeria
50.0
/100
|
#175
Average
1.2%

Sierra Leonean Disability Age Under 5 Correlation Summary

MeasurementSierra Leonean DataDisability Age Under 5 Data
Minimum0.012%0.32%
Maximum3.1%8.2%
Range3.0%7.9%
Mean0.79%1.7%
Median0.57%1.0%
Interquartile 25% (IQ1)0.28%0.74%
Interquartile 75% (IQ3)1.1%2.2%
Interquartile Range (IQR)0.77%1.5%
Standard Deviation (Sample)0.75%1.7%
Standard Deviation (Population)0.74%1.7%

Correlation Details

Sierra Leonean PercentileSample SizeDisability Age Under 5
[
0.0%
-
0.5%
]
0.012%
51,077,3980.74%
[
0.0%
-
0.5%
]
0.055%
7,917,1640.88%
[
0.0%
-
0.5%
]
0.092%
1,175,9460.81%
[
0.0%
-
0.5%
]
0.13%
668,4732.2%
[
0.0%
-
0.5%
]
0.17%
1,524,4230.97%
[
0.0%
-
0.5%
]
0.20%
523,1091.0%
[
0.0%
-
0.5%
]
0.24%
366,6712.7%
[
0.0%
-
0.5%
]
0.28%
325,8361.6%
[
0.0%
-
0.5%
]
0.32%
125,0900.53%
[
0.0%
-
0.5%
]
0.35%
197,2221.0%
[
0.0%
-
0.5%
]
0.38%
210,2080.97%
[
0.0%
-
0.5%
]
0.43%
287,2571.5%
[
0.0%
-
0.5%
]
0.47%
127,5190.95%
[
0.5%
-
1.0%
]
0.51%
98,1283.9%
[
0.5%
-
1.0%
]
0.54%
72,2150.32%
[
0.5%
-
1.0%
]
0.57%
252,8140.68%
[
0.5%
-
1.0%
]
0.65%
26,6531.1%
[
0.5%
-
1.0%
]
0.69%
112,9542.0%
[
0.5%
-
1.0%
]
0.72%
46,0950.51%
[
0.5%
-
1.0%
]
0.78%
64,7460.35%
[
0.5%
-
1.0%
]
0.87%
20,9353.6%
[
0.5%
-
1.0%
]
0.93%
25,9875.3%
[
1.0%
-
1.5%
]
1.00%
30,9243.6%
[
1.0%
-
1.5%
]
1.05%
20,9360.61%
[
1.0%
-
1.5%
]
1.11%
19,7620.68%
[
1.0%
-
1.5%
]
1.26%
36,5461.2%
[
1.0%
-
1.5%
]
1.38%
10,8462.2%
[
1.0%
-
1.5%
]
1.44%
23,1411.0%
[
1.5%
-
2.0%
]
1.85%
11,4551.3%
[
3.0%
-
3.5%
]
3.03%
9,1838.2%
[
3.0%
-
3.5%
]
3.06%
19,5311.2%