German Russian Disability Age Under 5

COMPARE

German Russian
Race
Ancestry
AfghanAfricanAlaska NativeAlaskan AthabascanAlbanianAleutAlsatianAmericanApacheArabArapahoArgentineanArmenianAssyrian/Chaldean/SyriacAustralianAustrianBahamianBangladeshiBarbadianBasqueBelgianBelizeanBermudanBhutaneseBlackfeetBolivianBrazilianBritishBritish West IndianBulgarianBurmeseCajunCambodianCanadianCape VerdeanCarpatho RusynCelticCentral AmericanCentral American IndianCherokeeCheyenneChickasawChileanChineseChippewaChoctawColombianColvilleComancheCosta RicanCreeCreekCroatianCrowCubanCypriotCzechCzechoslovakianDanishDelawareDominicanDutchDutch West IndianEastern EuropeanEcuadorianEgyptianEnglishEstonianEthiopianEuropeanFijianFilipinoFinnishFrenchFrench American IndianFrench CanadianGermanGerman RussianGhanaianGreekGuamanian/ChamorroGuatemalanGuyaneseHaitianHmongHonduranHopiHoumaHungarianIcelanderIndian (Asian)IndonesianInupiatIranianIraqiIrishIroquoisIsraeliItalianJamaicanJapaneseJordanianKenyanKiowaKoreanLaotianLatvianLebaneseLiberianLithuanianLumbeeLuxembourgerMacedonianMalaysianMalteseMarshalleseMenomineeMexicanMexican American IndianMongolianMoroccanNative HawaiianNavajoNepaleseNew ZealanderNicaraguanNigerianNorthern EuropeanNorwegianOkinawanOsageOttawaPaiutePakistaniPalestinianPanamanianParaguayanPennsylvania GermanPeruvianPimaPolishPortuguesePotawatomiPuebloPuerto RicanPuget Sound SalishRomanianRussianSalvadoranSamoanScandinavianScotch-IrishScottishSeminoleSenegaleseSerbianShoshoneSierra LeoneanSiouxSlavicSlovakSloveneSomaliSouth AfricanSouth AmericanSouth American IndianSoviet UnionSpaniardSpanishSpanish AmericanSpanish American IndianSri LankanSubsaharan AfricanSudaneseSwedishSwissSyrianTaiwaneseThaiTlingit-HaidaTohono O'OdhamTonganTrinidadian and TobagonianTsimshianTurkishU.S. Virgin IslanderUgandanUkrainianUruguayanUteVenezuelanVietnameseWelshWest IndianYakamaYaquiYugoslavianYumanYup'ikZimbabwean
Immigration
NonimmigrantsImmigrantsAfghanistanAfricaAlbaniaArgentinaArmeniaAsiaAustraliaAustriaBahamasBangladeshBarbadosBelarusBelgiumBelizeBoliviaBosnia and HerzegovinaBrazilBulgariaBurma/MyanmarCabo VerdeCambodiaCameroonCanadaCaribbeanCentral AmericaChileChinaColombiaCongoCosta RicaCroatiaCubaCzechoslovakiaDenmarkDominicaDominican RepublicEastern AfricaEastern AsiaEastern EuropeEcuadorEgyptEl SalvadorEnglandEritreaEthiopiaEuropeFijiFranceGermanyGhanaGreeceGrenadaGuatemalaGuyanaHaitiHondurasHong KongHungaryIndiaIndonesiaIranIraqIrelandIsraelItalyJamaicaJapanJordanKazakhstanKenyaKoreaKuwaitLaosLatin AmericaLatviaLebanonLiberiaLithuaniaMalaysiaMexicoMicronesiaMiddle AfricaMoldovaMoroccoNepalNetherlandsNicaraguaNigeriaNorth AmericaNorth MacedoniaNorthern AfricaNorthern EuropeNorwayOceaniaPakistanPanamaPeruPhilippinesPolandPortugalRomaniaRussiaSaudi ArabiaScotlandSenegalSerbiaSierra LeoneSingaporeSomaliaSouth AfricaSouth AmericaSouth Central AsiaSouth Eastern AsiaSouthern EuropeSpainSri LankaSt. Vincent and the GrenadinesSudanSwedenSwitzerlandSyriaTaiwanThailandTrinidad and TobagoTurkeyUgandaUkraineUruguayUzbekistanVenezuelaVietnamWest IndiesWestern AfricaWestern AsiaWestern EuropeYemenZaireZimbabweAzores
Select to Compare
Race
Ancestry
AfghanAfricanAlaska NativeAlaskan AthabascanAlbanianAleutAlsatianAmericanApacheArabArapahoArgentineanArmenianAssyrian/Chaldean/SyriacAustralianAustrianBahamianBangladeshiBarbadianBasqueBelgianBelizeanBermudanBhutaneseBlackfeetBolivianBrazilianBritishBritish West IndianBulgarianBurmeseCajunCambodianCanadianCape VerdeanCarpatho RusynCelticCentral AmericanCentral American IndianCherokeeCheyenneChickasawChileanChineseChippewaChoctawColombianColvilleComancheCosta RicanCreeCreekCroatianCrowCubanCypriotCzechCzechoslovakianDanishDelawareDominicanDutchDutch West IndianEastern EuropeanEcuadorianEgyptianEnglishEstonianEthiopianEuropeanFijianFilipinoFinnishFrenchFrench American IndianFrench CanadianGermanGhanaianGreekGuamanian/ChamorroGuatemalanGuyaneseHaitianHmongHonduranHopiHoumaHungarianIcelanderIndian (Asian)IndonesianInupiatIranianIraqiIrishIroquoisIsraeliItalianJamaicanJapaneseJordanianKenyanKiowaKoreanLaotianLatvianLebaneseLiberianLithuanianLumbeeLuxembourgerMacedonianMalaysianMalteseMarshalleseMenomineeMexicanMexican American IndianMongolianMoroccanNative HawaiianNavajoNepaleseNew ZealanderNicaraguanNigerianNorthern EuropeanNorwegianOkinawanOsageOttawaPaiutePakistaniPalestinianPanamanianParaguayanPennsylvania GermanPeruvianPimaPolishPortuguesePotawatomiPuebloPuerto RicanPuget Sound SalishRomanianRussianSalvadoranSamoanScandinavianScotch-IrishScottishSeminoleSenegaleseSerbianShoshoneSierra LeoneanSiouxSlavicSlovakSloveneSomaliSouth AfricanSouth AmericanSouth American IndianSoviet UnionSpaniardSpanishSpanish AmericanSpanish American IndianSri LankanSubsaharan AfricanSudaneseSwedishSwissSyrianTaiwaneseThaiTlingit-HaidaTohono O'OdhamTonganTrinidadian and TobagonianTsimshianTurkishU.S. Virgin IslanderUgandanUkrainianUruguayanUteVenezuelanVietnameseWelshWest IndianYakamaYaquiYugoslavianYumanYup'ikZimbabwean
Immigration
NonimmigrantsImmigrantsAfghanistanAfricaAlbaniaArgentinaArmeniaAsiaAustraliaAustriaBahamasBangladeshBarbadosBelarusBelgiumBelizeBoliviaBosnia and HerzegovinaBrazilBulgariaBurma/MyanmarCabo VerdeCambodiaCameroonCanadaCaribbeanCentral AmericaChileChinaColombiaCongoCosta RicaCroatiaCubaCzechoslovakiaDenmarkDominicaDominican RepublicEastern AfricaEastern AsiaEastern EuropeEcuadorEgyptEl SalvadorEnglandEritreaEthiopiaEuropeFijiFranceGermanyGhanaGreeceGrenadaGuatemalaGuyanaHaitiHondurasHong KongHungaryIndiaIndonesiaIranIraqIrelandIsraelItalyJamaicaJapanJordanKazakhstanKenyaKoreaKuwaitLaosLatin AmericaLatviaLebanonLiberiaLithuaniaMalaysiaMexicoMicronesiaMiddle AfricaMoldovaMoroccoNepalNetherlandsNicaraguaNigeriaNorth AmericaNorth MacedoniaNorthern AfricaNorthern EuropeNorwayOceaniaPakistanPanamaPeruPhilippinesPolandPortugalRomaniaRussiaSaudi ArabiaScotlandSenegalSerbiaSierra LeoneSingaporeSomaliaSouth AfricaSouth AmericaSouth Central AsiaSouth Eastern AsiaSouthern EuropeSpainSri LankaSt. Vincent and the GrenadinesSudanSwedenSwitzerlandSyriaTaiwanThailandTrinidad and TobagoTurkeyUgandaUkraineUruguayUzbekistanVenezuelaVietnamWest IndiesWestern AfricaWestern AsiaWestern EuropeYemenZaireZimbabweAzores
Disability Age Under 5
Income
Poverty
Unemployment
Labor Participation
Family Structure
Vehicle Availability
Education Level
Disability

German Russian Disability Age Under 5
Tragic

1.6%
DISABILITY | AGE UNDER 5
0.0/ 100
METRIC RATING
301st/ 347
METRIC RANK

German Russian Disability Age Under 5 Correlation Chart

The statistical analysis conducted on geographies consisting of 78,222,474 people shows a substantial positive correlation between the proportion of German Russians and percentage of population with a disability under the age of 5 in the United States with a correlation coefficient (R) of 0.553 and weighted average of 1.6%. On average, for every 1% (one percent) increase in German Russians within a typical geography, there is an increase of 4.6% in percentage of population with a disability under the age of 5.
German Russian Disability Age Under 5
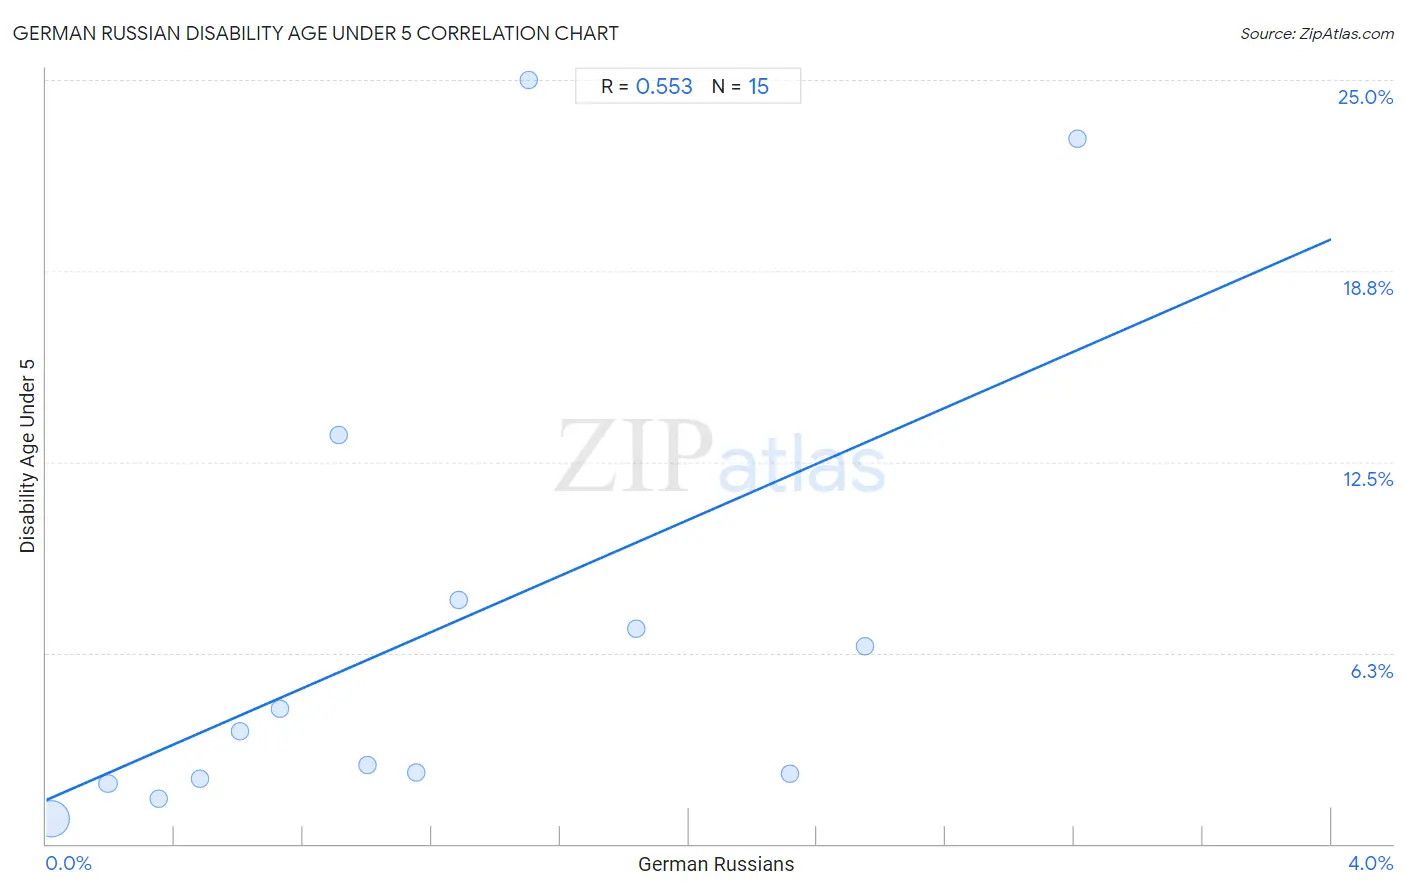
It is essential to understand that the correlation between the percentage of German Russians and percentage of population with a disability under the age of 5 does not imply a direct cause-and-effect relationship. It remains uncertain whether the presence of German Russians influences an upward or downward trend in the level of percentage of population with a disability under the age of 5 within an area, or if German Russians simply ended up residing in those areas with higher or lower levels of percentage of population with a disability under the age of 5 due to other factors.

Demographics Similar to German Russians by Disability Age Under 5

In terms of disability age under 5, the demographic groups most similar to German Russians are Welsh (1.6%, a difference of 0.12%), Swiss (1.6%, a difference of 0.27%), Shoshone (1.6%, a difference of 0.44%), Portuguese (1.6%, a difference of 0.78%), and Seminole (1.6%, a difference of 0.91%).
DemographicsRating | RankDisability Age Under 5
Swedes
0.0
/100
|
#294
Tragic
1.6%
Finns
0.0
/100
|
#295
Tragic
1.6%
Poles
0.0
/100
|
#296
Tragic
1.6%
Nonimmigrants
0.0
/100
|
#297
Tragic
1.6%
Cajuns
0.0
/100
|
#298
Tragic
1.6%
Portuguese
0.0
/100
|
#299
Tragic
1.6%
Shoshone
0.0
/100
|
#300
Tragic
1.6%
German Russians
0.0
/100
|
#301
Tragic
1.6%
Welsh
0.0
/100
|
#302
Tragic
1.6%
Swiss
0.0
/100
|
#303
Tragic
1.6%
Seminole
0.0
/100
|
#304
Tragic
1.6%
Blackfeet
0.0
/100
|
#305
Tragic
1.6%
Creek
0.0
/100
|
#306
Tragic
1.6%
Scottish
0.0
/100
|
#307
Tragic
1.6%
Navajo
0.0
/100
|
#308
Tragic
1.6%

German Russian Disability Age Under 5 Correlation Summary

MeasurementGerman Russian DataDisability Age Under 5 Data
Minimum0.017%0.81%
Maximum3.2%25.0%
Range3.2%24.2%
Mean1.2%7.0%
Median1.0%3.7%
Interquartile 25% (IQ1)0.48%2.1%
Interquartile 75% (IQ3)1.8%8.0%
Interquartile Range (IQR)1.4%5.8%
Standard Deviation (Sample)0.92%7.7%
Standard Deviation (Population)0.89%7.4%

Correlation Details

German Russian PercentileSample SizeDisability Age Under 5
[
0.0%
-
0.5%
]
0.017%
76,044,7530.81%
[
0.0%
-
0.5%
]
0.19%
1,386,7082.0%
[
0.0%
-
0.5%
]
0.35%
287,6541.5%
[
0.0%
-
0.5%
]
0.48%
189,7772.1%
[
0.5%
-
1.0%
]
0.60%
99,4083.7%
[
0.5%
-
1.0%
]
0.73%
50,6034.4%
[
0.5%
-
1.0%
]
0.91%
2,52613.4%
[
1.0%
-
1.5%
]
1.00%
76,1862.6%
[
1.0%
-
1.5%
]
1.15%
30,5232.3%
[
1.0%
-
1.5%
]
1.28%
22,1058.0%
[
1.0%
-
1.5%
]
1.50%
20025.0%
[
1.5%
-
2.0%
]
1.84%
27,0027.0%
[
2.0%
-
2.5%
]
2.31%
2,0752.3%
[
2.5%
-
3.0%
]
2.55%
1,3356.5%
[
3.0%
-
3.5%
]
3.21%
1,61923.1%