French Disability Age Under 5

COMPARE

French
Race
Ancestry
AfghanAfricanAlaska NativeAlaskan AthabascanAlbanianAleutAlsatianAmericanApacheArabArapahoArgentineanArmenianAssyrian/Chaldean/SyriacAustralianAustrianBahamianBangladeshiBarbadianBasqueBelgianBelizeanBermudanBhutaneseBlackfeetBolivianBrazilianBritishBritish West IndianBulgarianBurmeseCajunCambodianCanadianCape VerdeanCarpatho RusynCelticCentral AmericanCentral American IndianCherokeeCheyenneChickasawChileanChineseChippewaChoctawColombianColvilleComancheCosta RicanCreeCreekCroatianCrowCubanCypriotCzechCzechoslovakianDanishDelawareDominicanDutchDutch West IndianEastern EuropeanEcuadorianEgyptianEnglishEstonianEthiopianEuropeanFijianFilipinoFinnishFrenchFrench American IndianFrench CanadianGermanGerman RussianGhanaianGreekGuamanian/ChamorroGuatemalanGuyaneseHaitianHmongHonduranHopiHoumaHungarianIcelanderIndian (Asian)IndonesianInupiatIranianIraqiIrishIroquoisIsraeliItalianJamaicanJapaneseJordanianKenyanKiowaKoreanLaotianLatvianLebaneseLiberianLithuanianLumbeeLuxembourgerMacedonianMalaysianMalteseMarshalleseMenomineeMexicanMexican American IndianMongolianMoroccanNative HawaiianNavajoNepaleseNew ZealanderNicaraguanNigerianNorthern EuropeanNorwegianOkinawanOsageOttawaPaiutePakistaniPalestinianPanamanianParaguayanPennsylvania GermanPeruvianPimaPolishPortuguesePotawatomiPuebloPuerto RicanPuget Sound SalishRomanianRussianSalvadoranSamoanScandinavianScotch-IrishScottishSeminoleSenegaleseSerbianShoshoneSierra LeoneanSiouxSlavicSlovakSloveneSomaliSouth AfricanSouth AmericanSouth American IndianSoviet UnionSpaniardSpanishSpanish AmericanSpanish American IndianSri LankanSubsaharan AfricanSudaneseSwedishSwissSyrianTaiwaneseThaiTlingit-HaidaTohono O'OdhamTonganTrinidadian and TobagonianTsimshianTurkishU.S. Virgin IslanderUgandanUkrainianUruguayanUteVenezuelanVietnameseWelshWest IndianYakamaYaquiYugoslavianYumanYup'ikZimbabwean
Immigration
NonimmigrantsImmigrantsAfghanistanAfricaAlbaniaArgentinaArmeniaAsiaAustraliaAustriaBahamasBangladeshBarbadosBelarusBelgiumBelizeBoliviaBosnia and HerzegovinaBrazilBulgariaBurma/MyanmarCabo VerdeCambodiaCameroonCanadaCaribbeanCentral AmericaChileChinaColombiaCongoCosta RicaCroatiaCubaCzechoslovakiaDenmarkDominicaDominican RepublicEastern AfricaEastern AsiaEastern EuropeEcuadorEgyptEl SalvadorEnglandEritreaEthiopiaEuropeFijiFranceGermanyGhanaGreeceGrenadaGuatemalaGuyanaHaitiHondurasHong KongHungaryIndiaIndonesiaIranIraqIrelandIsraelItalyJamaicaJapanJordanKazakhstanKenyaKoreaKuwaitLaosLatin AmericaLatviaLebanonLiberiaLithuaniaMalaysiaMexicoMicronesiaMiddle AfricaMoldovaMoroccoNepalNetherlandsNicaraguaNigeriaNorth AmericaNorth MacedoniaNorthern AfricaNorthern EuropeNorwayOceaniaPakistanPanamaPeruPhilippinesPolandPortugalRomaniaRussiaSaudi ArabiaScotlandSenegalSerbiaSierra LeoneSingaporeSomaliaSouth AfricaSouth AmericaSouth Central AsiaSouth Eastern AsiaSouthern EuropeSpainSri LankaSt. Vincent and the GrenadinesSudanSwedenSwitzerlandSyriaTaiwanThailandTrinidad and TobagoTurkeyUgandaUkraineUruguayUzbekistanVenezuelaVietnamWest IndiesWestern AfricaWestern AsiaWestern EuropeYemenZaireZimbabweAzores
Select to Compare
Race
Ancestry
AfghanAfricanAlaska NativeAlaskan AthabascanAlbanianAleutAlsatianAmericanApacheArabArapahoArgentineanArmenianAssyrian/Chaldean/SyriacAustralianAustrianBahamianBangladeshiBarbadianBasqueBelgianBelizeanBermudanBhutaneseBlackfeetBolivianBrazilianBritishBritish West IndianBulgarianBurmeseCajunCambodianCanadianCape VerdeanCarpatho RusynCelticCentral AmericanCentral American IndianCherokeeCheyenneChickasawChileanChineseChippewaChoctawColombianColvilleComancheCosta RicanCreeCreekCroatianCrowCubanCypriotCzechCzechoslovakianDanishDelawareDominicanDutchDutch West IndianEastern EuropeanEcuadorianEgyptianEnglishEstonianEthiopianEuropeanFijianFilipinoFinnishFrench American IndianFrench CanadianGermanGerman RussianGhanaianGreekGuamanian/ChamorroGuatemalanGuyaneseHaitianHmongHonduranHopiHoumaHungarianIcelanderIndian (Asian)IndonesianInupiatIranianIraqiIrishIroquoisIsraeliItalianJamaicanJapaneseJordanianKenyanKiowaKoreanLaotianLatvianLebaneseLiberianLithuanianLumbeeLuxembourgerMacedonianMalaysianMalteseMarshalleseMenomineeMexicanMexican American IndianMongolianMoroccanNative HawaiianNavajoNepaleseNew ZealanderNicaraguanNigerianNorthern EuropeanNorwegianOkinawanOsageOttawaPaiutePakistaniPalestinianPanamanianParaguayanPennsylvania GermanPeruvianPimaPolishPortuguesePotawatomiPuebloPuerto RicanPuget Sound SalishRomanianRussianSalvadoranSamoanScandinavianScotch-IrishScottishSeminoleSenegaleseSerbianShoshoneSierra LeoneanSiouxSlavicSlovakSloveneSomaliSouth AfricanSouth AmericanSouth American IndianSoviet UnionSpaniardSpanishSpanish AmericanSpanish American IndianSri LankanSubsaharan AfricanSudaneseSwedishSwissSyrianTaiwaneseThaiTlingit-HaidaTohono O'OdhamTonganTrinidadian and TobagonianTsimshianTurkishU.S. Virgin IslanderUgandanUkrainianUruguayanUteVenezuelanVietnameseWelshWest IndianYakamaYaquiYugoslavianYumanYup'ikZimbabwean
Immigration
NonimmigrantsImmigrantsAfghanistanAfricaAlbaniaArgentinaArmeniaAsiaAustraliaAustriaBahamasBangladeshBarbadosBelarusBelgiumBelizeBoliviaBosnia and HerzegovinaBrazilBulgariaBurma/MyanmarCabo VerdeCambodiaCameroonCanadaCaribbeanCentral AmericaChileChinaColombiaCongoCosta RicaCroatiaCubaCzechoslovakiaDenmarkDominicaDominican RepublicEastern AfricaEastern AsiaEastern EuropeEcuadorEgyptEl SalvadorEnglandEritreaEthiopiaEuropeFijiFranceGermanyGhanaGreeceGrenadaGuatemalaGuyanaHaitiHondurasHong KongHungaryIndiaIndonesiaIranIraqIrelandIsraelItalyJamaicaJapanJordanKazakhstanKenyaKoreaKuwaitLaosLatin AmericaLatviaLebanonLiberiaLithuaniaMalaysiaMexicoMicronesiaMiddle AfricaMoldovaMoroccoNepalNetherlandsNicaraguaNigeriaNorth AmericaNorth MacedoniaNorthern AfricaNorthern EuropeNorwayOceaniaPakistanPanamaPeruPhilippinesPolandPortugalRomaniaRussiaSaudi ArabiaScotlandSenegalSerbiaSierra LeoneSingaporeSomaliaSouth AfricaSouth AmericaSouth Central AsiaSouth Eastern AsiaSouthern EuropeSpainSri LankaSt. Vincent and the GrenadinesSudanSwedenSwitzerlandSyriaTaiwanThailandTrinidad and TobagoTurkeyUgandaUkraineUruguayUzbekistanVenezuelaVietnamWest IndiesWestern AfricaWestern AsiaWestern EuropeYemenZaireZimbabweAzores
Disability Age Under 5
Income
Poverty
Unemployment
Labor Participation
Family Structure
Vehicle Availability
Education Level
Disability

French Disability Age Under 5
Tragic

1.7%
DISABILITY | AGE UNDER 5
0.0/ 100
METRIC RATING
317th/ 347
METRIC RANK

French Disability Age Under 5 Correlation Chart

The statistical analysis conducted on geographies consisting of 260,987,253 people shows a moderate positive correlation between the proportion of French and percentage of population with a disability under the age of 5 in the United States with a correlation coefficient (R) of 0.411 and weighted average of 1.7%. On average, for every 1% (one percent) increase in French within a typical geography, there is an increase of 0.23% in percentage of population with a disability under the age of 5.
French Disability Age Under 5
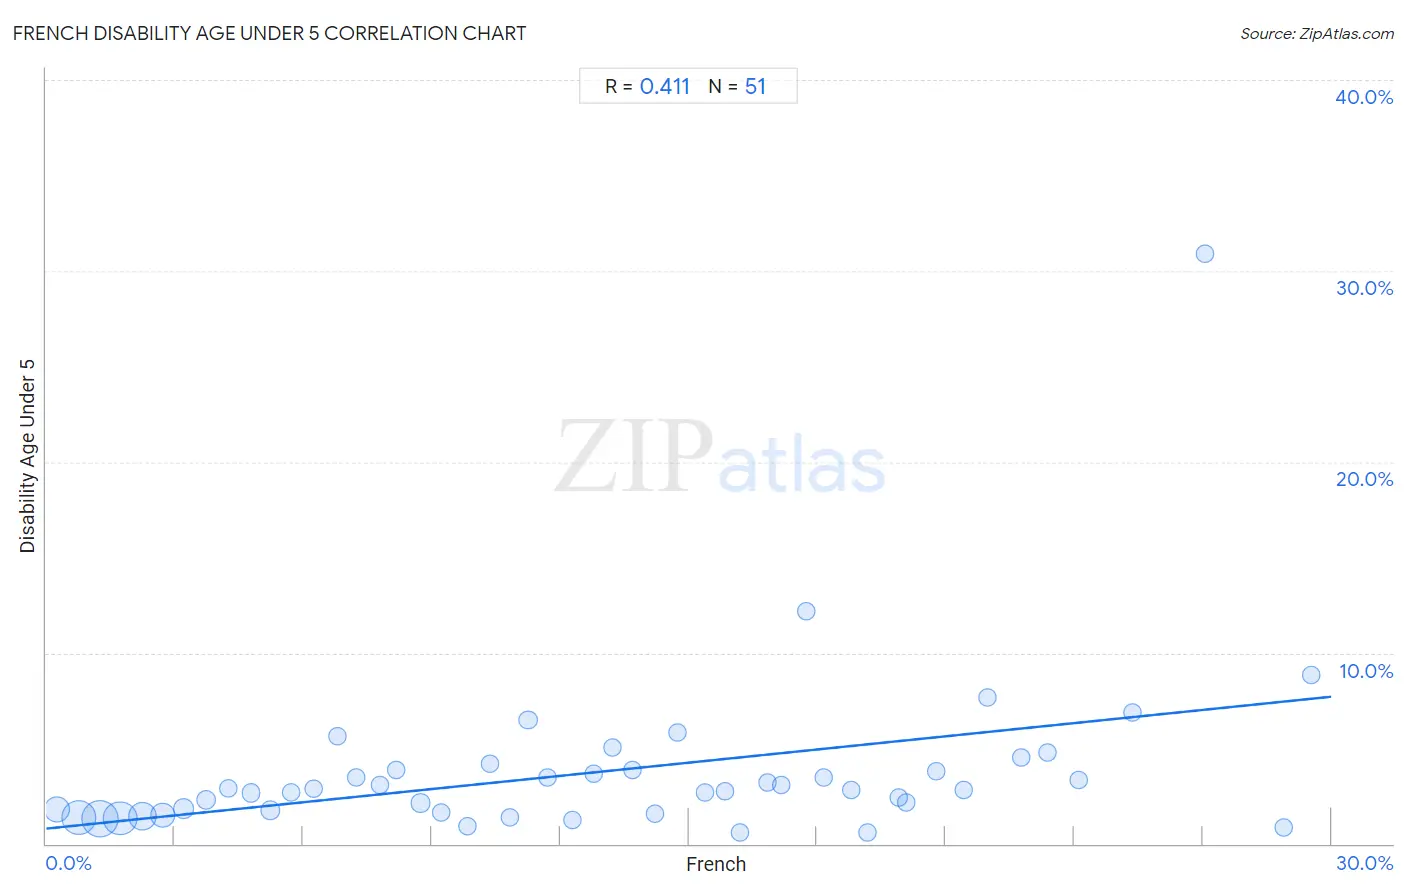
It is essential to understand that the correlation between the percentage of French and percentage of population with a disability under the age of 5 does not imply a direct cause-and-effect relationship. It remains uncertain whether the presence of French influences an upward or downward trend in the level of percentage of population with a disability under the age of 5 within an area, or if French simply ended up residing in those areas with higher or lower levels of percentage of population with a disability under the age of 5 due to other factors.

Demographics Similar to French by Disability Age Under 5

In terms of disability age under 5, the demographic groups most similar to French are Irish (1.7%, a difference of 0.27%), Immigrants from Cabo Verde (1.7%, a difference of 0.42%), Slovak (1.7%, a difference of 0.58%), Dutch (1.7%, a difference of 0.61%), and Norwegian (1.7%, a difference of 0.87%).
DemographicsRating | RankDisability Age Under 5
Whites/Caucasians
0.0
/100
|
#310
Tragic
1.7%
English
0.0
/100
|
#311
Tragic
1.7%
Puerto Ricans
0.0
/100
|
#312
Tragic
1.7%
Celtics
0.0
/100
|
#313
Tragic
1.7%
Norwegians
0.0
/100
|
#314
Tragic
1.7%
Dutch
0.0
/100
|
#315
Tragic
1.7%
Immigrants from Cabo Verde
0.0
/100
|
#316
Tragic
1.7%
French
0.0
/100
|
#317
Tragic
1.7%
Irish
0.0
/100
|
#318
Tragic
1.7%
Slovaks
0.0
/100
|
#319
Tragic
1.7%
Scotch-Irish
0.0
/100
|
#320
Tragic
1.7%
Ottawa
0.0
/100
|
#321
Tragic
1.7%
Germans
0.0
/100
|
#322
Tragic
1.7%
Chickasaw
0.0
/100
|
#323
Tragic
1.7%
Cherokee
0.0
/100
|
#324
Tragic
1.8%

French Disability Age Under 5 Correlation Summary

MeasurementFrench DataDisability Age Under 5 Data
Minimum0.25%0.58%
Maximum29.5%30.9%
Range29.3%30.3%
Mean13.0%3.8%
Median12.8%2.8%
Interquartile 25% (IQ1)6.2%1.7%
Interquartile 75% (IQ3)19.2%3.9%
Interquartile Range (IQR)13.0%2.2%
Standard Deviation (Sample)7.9%4.5%
Standard Deviation (Population)7.9%4.4%

Correlation Details

French PercentileSample SizeDisability Age Under 5
[
0.0%
-
0.5%
]
0.25%
27,196,8011.8%
[
0.5%
-
1.0%
]
0.77%
50,600,4411.4%
[
1.0%
-
1.5%
]
1.25%
58,910,5981.3%
[
1.5%
-
2.0%
]
1.73%
50,039,8251.3%
[
2.0%
-
2.5%
]
2.24%
31,493,5871.4%
[
2.5%
-
3.0%
]
2.72%
18,232,5321.5%
[
3.0%
-
3.5%
]
3.22%
8,377,9541.8%
[
3.5%
-
4.0%
]
3.73%
4,698,9692.3%
[
4.0%
-
4.5%
]
4.25%
2,538,2102.9%
[
4.5%
-
5.0%
]
4.77%
1,316,3892.7%
[
5.0%
-
5.5%
]
5.23%
1,966,6921.8%
[
5.5%
-
6.0%
]
5.73%
780,0632.7%
[
6.0%
-
6.5%
]
6.23%
440,3072.9%
[
6.5%
-
7.0%
]
6.79%
347,2375.6%
[
7.0%
-
7.5%
]
7.24%
316,0483.5%
[
7.5%
-
8.0%
]
7.78%
238,9853.1%
[
8.0%
-
8.5%
]
8.17%
300,2013.9%
[
8.5%
-
9.0%
]
8.74%
377,6962.1%
[
9.0%
-
9.5%
]
9.22%
269,1831.7%
[
9.5%
-
10.0%
]
9.83%
227,7540.91%
[
10.0%
-
10.5%
]
10.35%
46,4984.2%
[
10.5%
-
11.0%
]
10.82%
566,7171.4%
[
11.0%
-
11.5%
]
11.25%
88,3396.5%
[
11.5%
-
12.0%
]
11.70%
20,0153.5%
[
12.0%
-
12.5%
]
12.28%
166,2971.2%
[
12.5%
-
13.0%
]
12.78%
137,7443.6%
[
13.0%
-
13.5%
]
13.22%
145,1385.0%
[
13.5%
-
14.0%
]
13.69%
133,1893.9%
[
14.0%
-
14.5%
]
14.21%
219,2771.5%
[
14.5%
-
15.0%
]
14.74%
40,0765.8%
[
15.0%
-
15.5%
]
15.38%
72,7142.7%
[
15.5%
-
16.0%
]
15.85%
102,2782.8%
[
16.0%
-
16.5%
]
16.18%
191,9530.60%
[
16.5%
-
17.0%
]
16.85%
36,3033.2%
[
17.0%
-
17.5%
]
17.17%
47,8203.1%
[
17.5%
-
18.0%
]
17.75%
26,68012.2%
[
18.0%
-
18.5%
]
18.16%
88,3523.5%
[
18.5%
-
19.0%
]
18.80%
22,3022.8%
[
19.0%
-
19.5%
]
19.19%
26,4630.58%
[
19.5%
-
20.0%
]
19.91%
45,7622.4%
[
20.0%
-
20.5%
]
20.07%
6,1932.2%
[
20.5%
-
21.0%
]
20.77%
31,7153.8%
[
21.0%
-
21.5%
]
21.43%
30,3822.8%
[
21.5%
-
22.0%
]
21.98%
2,9267.7%
[
22.5%
-
23.0%
]
22.76%
4,7284.5%
[
23.0%
-
23.5%
]
23.38%
9,6284.8%
[
24.0%
-
24.5%
]
24.12%
8503.3%
[
25.0%
-
25.5%
]
25.36%
1,8936.9%
[
27.0%
-
27.5%
]
27.06%
86130.9%
[
28.5%
-
29.0%
]
28.89%
2,2150.88%
[
29.5%
-
30.0%
]
29.52%
2,4738.8%