Immigrants from Albania Disability Age Under 5
COMPARE
Immigrants from Albania
Select to Compare
Disability Age Under 5
Immigrants from Albania Disability Age Under 5
1.1%
DISABILITY | AGE UNDER 5
99.9/ 100
METRIC RATING
40th/ 347
METRIC RANK
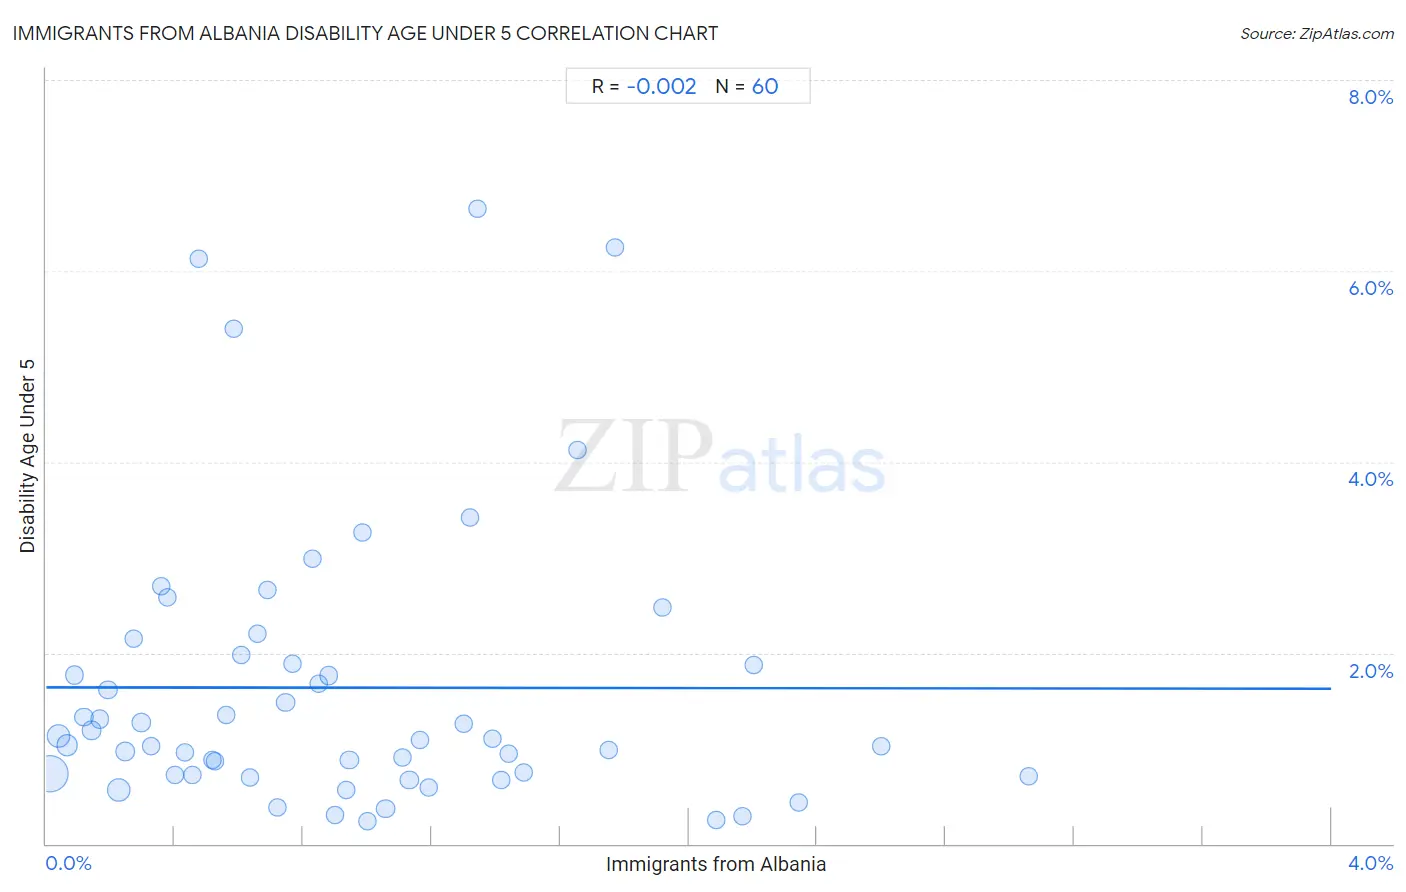
Immigrants from Albania Disability Age Under 5 Correlation Chart
The statistical analysis conducted on geographies consisting of 82,683,996 people shows no correlation between the proportion of Immigrants from Albania and percentage of population with a disability under the age of 5 in the United States with a correlation coefficient (R) of -0.002 and weighted average of 1.1%. On average, for every 1% (one percent) increase in Immigrants from Albania within a typical geography, there is a decrease of 0.0037% in percentage of population with a disability under the age of 5.
It is essential to understand that the correlation between the percentage of Immigrants from Albania and percentage of population with a disability under the age of 5 does not imply a direct cause-and-effect relationship. It remains uncertain whether the presence of Immigrants from Albania influences an upward or downward trend in the level of percentage of population with a disability under the age of 5 within an area, or if Immigrants from Albania simply ended up residing in those areas with higher or lower levels of percentage of population with a disability under the age of 5 due to other factors.
Demographics Similar to Immigrants from Albania by Disability Age Under 5
In terms of disability age under 5, the demographic groups most similar to Immigrants from Albania are Filipino (1.1%, a difference of 0.33%), Thai (1.1%, a difference of 0.41%), Immigrants from Bulgaria (1.1%, a difference of 0.51%), Pima (1.1%, a difference of 0.52%), and Immigrants from Asia (1.1%, a difference of 0.61%).
| Demographics | Rating | Rank | Disability Age Under 5 |
| Bolivians | 99.9 /100 | #33 | Exceptional 1.0% |
| Immigrants from Ukraine | 99.9 /100 | #34 | Exceptional 1.0% |
| Barbadians | 99.9 /100 | #35 | Exceptional 1.0% |
| Immigrants from Nepal | 99.9 /100 | #36 | Exceptional 1.0% |
| Immigrants from India | 99.9 /100 | #37 | Exceptional 1.0% |
| Immigrants from Guyana | 99.9 /100 | #38 | Exceptional 1.0% |
| Filipinos | 99.9 /100 | #39 | Exceptional 1.1% |
| Immigrants from Albania | 99.9 /100 | #40 | Exceptional 1.1% |
| Thais | 99.8 /100 | #41 | Exceptional 1.1% |
| Immigrants from Bulgaria | 99.8 /100 | #42 | Exceptional 1.1% |
| Pima | 99.8 /100 | #43 | Exceptional 1.1% |
| Immigrants from Asia | 99.8 /100 | #44 | Exceptional 1.1% |
| Immigrants from Turkey | 99.8 /100 | #45 | Exceptional 1.1% |
| Immigrants from Congo | 99.8 /100 | #46 | Exceptional 1.1% |
| Immigrants from Sweden | 99.8 /100 | #47 | Exceptional 1.1% |
Immigrants from Albania Disability Age Under 5 Correlation Summary
| Measurement | Immigrants from Albania Data | Disability Age Under 5 Data |
| Minimum | 0.010% | 0.23% |
| Maximum | 3.1% | 6.6% |
| Range | 3.0% | 6.4% |
| Mean | 0.93% | 1.6% |
| Median | 0.80% | 1.1% |
| Interquartile 25% (IQ1) | 0.39% | 0.72% |
| Interquartile 75% (IQ3) | 1.3% | 1.9% |
| Interquartile Range (IQR) | 0.94% | 1.2% |
| Standard Deviation (Sample) | 0.70% | 1.5% |
| Standard Deviation (Population) | 0.69% | 1.5% |
Correlation Details
| Immigrants from Albania Percentile | Sample Size | Disability Age Under 5 |
[ 0.0% - 0.5% ] 0.010% | 38,335,829 | 0.73% |
[ 0.0% - 0.5% ] 0.038% | 11,199,468 | 1.1% |
[ 0.0% - 0.5% ] 0.065% | 6,629,197 | 1.0% |
[ 0.0% - 0.5% ] 0.088% | 2,260,526 | 1.8% |
[ 0.0% - 0.5% ] 0.12% | 1,834,762 | 1.3% |
[ 0.0% - 0.5% ] 0.14% | 1,185,325 | 1.2% |
[ 0.0% - 0.5% ] 0.17% | 1,068,527 | 1.3% |
[ 0.0% - 0.5% ] 0.19% | 579,270 | 1.6% |
[ 0.0% - 0.5% ] 0.23% | 10,227,501 | 0.57% |
[ 0.0% - 0.5% ] 0.25% | 1,692,520 | 0.97% |
[ 0.0% - 0.5% ] 0.27% | 252,548 | 2.1% |
[ 0.0% - 0.5% ] 0.29% | 2,326,751 | 1.3% |
[ 0.0% - 0.5% ] 0.33% | 366,861 | 1.0% |
[ 0.0% - 0.5% ] 0.36% | 109,499 | 2.7% |
[ 0.0% - 0.5% ] 0.38% | 493,708 | 2.6% |
[ 0.0% - 0.5% ] 0.40% | 207,256 | 0.72% |
[ 0.0% - 0.5% ] 0.43% | 387,934 | 0.96% |
[ 0.0% - 0.5% ] 0.45% | 149,451 | 0.72% |
[ 0.0% - 0.5% ] 0.47% | 2,111 | 6.1% |
[ 0.5% - 1.0% ] 0.52% | 162,347 | 0.87% |
[ 0.5% - 1.0% ] 0.53% | 64,932 | 0.86% |
[ 0.5% - 1.0% ] 0.56% | 150,020 | 1.3% |
[ 0.5% - 1.0% ] 0.58% | 11,655 | 5.4% |
[ 0.5% - 1.0% ] 0.61% | 55,723 | 2.0% |
[ 0.5% - 1.0% ] 0.63% | 37,267 | 0.69% |
[ 0.5% - 1.0% ] 0.66% | 116,558 | 2.2% |
[ 0.5% - 1.0% ] 0.69% | 273,527 | 2.7% |
[ 0.5% - 1.0% ] 0.72% | 297,503 | 0.38% |
[ 0.5% - 1.0% ] 0.75% | 87,378 | 1.5% |
[ 0.5% - 1.0% ] 0.77% | 27,928 | 1.9% |
[ 0.5% - 1.0% ] 0.83% | 88,104 | 3.0% |
[ 0.5% - 1.0% ] 0.85% | 103,693 | 1.7% |
[ 0.5% - 1.0% ] 0.88% | 171,571 | 1.8% |
[ 0.5% - 1.0% ] 0.90% | 29,216 | 0.31% |
[ 0.5% - 1.0% ] 0.93% | 94,355 | 0.57% |
[ 0.5% - 1.0% ] 0.94% | 44,196 | 0.88% |
[ 0.5% - 1.0% ] 0.98% | 16,786 | 3.3% |
[ 0.5% - 1.0% ] 1.00% | 139,427 | 0.23% |
[ 1.0% - 1.5% ] 1.06% | 121,169 | 0.37% |
[ 1.0% - 1.5% ] 1.11% | 102,027 | 0.91% |
[ 1.0% - 1.5% ] 1.13% | 114,480 | 0.67% |
[ 1.0% - 1.5% ] 1.16% | 117,412 | 1.1% |
[ 1.0% - 1.5% ] 1.19% | 22,072 | 0.59% |
[ 1.0% - 1.5% ] 1.30% | 26,488 | 1.3% |
[ 1.0% - 1.5% ] 1.32% | 15,459 | 3.4% |
[ 1.0% - 1.5% ] 1.34% | 8,859 | 6.6% |
[ 1.0% - 1.5% ] 1.39% | 47,230 | 1.1% |
[ 1.0% - 1.5% ] 1.42% | 45,207 | 0.67% |
[ 1.0% - 1.5% ] 1.44% | 204,191 | 0.94% |
[ 1.0% - 1.5% ] 1.49% | 133,744 | 0.75% |
[ 1.5% - 2.0% ] 1.65% | 13,924 | 4.1% |
[ 1.5% - 2.0% ] 1.75% | 50,868 | 0.98% |
[ 1.5% - 2.0% ] 1.77% | 226 | 6.2% |
[ 1.5% - 2.0% ] 1.92% | 108,261 | 2.5% |
[ 2.0% - 2.5% ] 2.09% | 44,255 | 0.25% |
[ 2.0% - 2.5% ] 2.17% | 105,521 | 0.28% |
[ 2.0% - 2.5% ] 2.20% | 28,248 | 1.9% |
[ 2.0% - 2.5% ] 2.34% | 20,678 | 0.43% |
[ 2.5% - 3.0% ] 2.60% | 43,232 | 1.0% |
[ 3.0% - 3.5% ] 3.06% | 29,215 | 0.71% |