Liberian Disability Age Under 5

COMPARE

Liberian
Race
Ancestry
AfghanAfricanAlaska NativeAlaskan AthabascanAlbanianAleutAlsatianAmericanApacheArabArapahoArgentineanArmenianAssyrian/Chaldean/SyriacAustralianAustrianBahamianBangladeshiBarbadianBasqueBelgianBelizeanBermudanBhutaneseBlackfeetBolivianBrazilianBritishBritish West IndianBulgarianBurmeseCajunCambodianCanadianCape VerdeanCarpatho RusynCelticCentral AmericanCentral American IndianCherokeeCheyenneChickasawChileanChineseChippewaChoctawColombianColvilleComancheCosta RicanCreeCreekCroatianCrowCubanCypriotCzechCzechoslovakianDanishDelawareDominicanDutchDutch West IndianEastern EuropeanEcuadorianEgyptianEnglishEstonianEthiopianEuropeanFijianFilipinoFinnishFrenchFrench American IndianFrench CanadianGermanGerman RussianGhanaianGreekGuamanian/ChamorroGuatemalanGuyaneseHaitianHmongHonduranHopiHoumaHungarianIcelanderIndian (Asian)IndonesianInupiatIranianIraqiIrishIroquoisIsraeliItalianJamaicanJapaneseJordanianKenyanKiowaKoreanLaotianLatvianLebaneseLiberianLithuanianLumbeeLuxembourgerMacedonianMalaysianMalteseMarshalleseMenomineeMexicanMexican American IndianMongolianMoroccanNative HawaiianNavajoNepaleseNew ZealanderNicaraguanNigerianNorthern EuropeanNorwegianOkinawanOsageOttawaPaiutePakistaniPalestinianPanamanianParaguayanPennsylvania GermanPeruvianPimaPolishPortuguesePotawatomiPuebloPuerto RicanPuget Sound SalishRomanianRussianSalvadoranSamoanScandinavianScotch-IrishScottishSeminoleSenegaleseSerbianShoshoneSierra LeoneanSiouxSlavicSlovakSloveneSomaliSouth AfricanSouth AmericanSouth American IndianSoviet UnionSpaniardSpanishSpanish AmericanSpanish American IndianSri LankanSubsaharan AfricanSudaneseSwedishSwissSyrianTaiwaneseThaiTlingit-HaidaTohono O'OdhamTonganTrinidadian and TobagonianTsimshianTurkishU.S. Virgin IslanderUgandanUkrainianUruguayanUteVenezuelanVietnameseWelshWest IndianYakamaYaquiYugoslavianYumanYup'ikZimbabwean
Immigration
NonimmigrantsImmigrantsAfghanistanAfricaAlbaniaArgentinaArmeniaAsiaAustraliaAustriaBahamasBangladeshBarbadosBelarusBelgiumBelizeBoliviaBosnia and HerzegovinaBrazilBulgariaBurma/MyanmarCabo VerdeCambodiaCameroonCanadaCaribbeanCentral AmericaChileChinaColombiaCongoCosta RicaCroatiaCubaCzechoslovakiaDenmarkDominicaDominican RepublicEastern AfricaEastern AsiaEastern EuropeEcuadorEgyptEl SalvadorEnglandEritreaEthiopiaEuropeFijiFranceGermanyGhanaGreeceGrenadaGuatemalaGuyanaHaitiHondurasHong KongHungaryIndiaIndonesiaIranIraqIrelandIsraelItalyJamaicaJapanJordanKazakhstanKenyaKoreaKuwaitLaosLatin AmericaLatviaLebanonLiberiaLithuaniaMalaysiaMexicoMicronesiaMiddle AfricaMoldovaMoroccoNepalNetherlandsNicaraguaNigeriaNorth AmericaNorth MacedoniaNorthern AfricaNorthern EuropeNorwayOceaniaPakistanPanamaPeruPhilippinesPolandPortugalRomaniaRussiaSaudi ArabiaScotlandSenegalSerbiaSierra LeoneSingaporeSomaliaSouth AfricaSouth AmericaSouth Central AsiaSouth Eastern AsiaSouthern EuropeSpainSri LankaSt. Vincent and the GrenadinesSudanSwedenSwitzerlandSyriaTaiwanThailandTrinidad and TobagoTurkeyUgandaUkraineUruguayUzbekistanVenezuelaVietnamWest IndiesWestern AfricaWestern AsiaWestern EuropeYemenZaireZimbabweAzores
Select to Compare
Race
Ancestry
AfghanAfricanAlaska NativeAlaskan AthabascanAlbanianAleutAlsatianAmericanApacheArabArapahoArgentineanArmenianAssyrian/Chaldean/SyriacAustralianAustrianBahamianBangladeshiBarbadianBasqueBelgianBelizeanBermudanBhutaneseBlackfeetBolivianBrazilianBritishBritish West IndianBulgarianBurmeseCajunCambodianCanadianCape VerdeanCarpatho RusynCelticCentral AmericanCentral American IndianCherokeeCheyenneChickasawChileanChineseChippewaChoctawColombianColvilleComancheCosta RicanCreeCreekCroatianCrowCubanCypriotCzechCzechoslovakianDanishDelawareDominicanDutchDutch West IndianEastern EuropeanEcuadorianEgyptianEnglishEstonianEthiopianEuropeanFijianFilipinoFinnishFrenchFrench American IndianFrench CanadianGermanGerman RussianGhanaianGreekGuamanian/ChamorroGuatemalanGuyaneseHaitianHmongHonduranHopiHoumaHungarianIcelanderIndian (Asian)IndonesianInupiatIranianIraqiIrishIroquoisIsraeliItalianJamaicanJapaneseJordanianKenyanKiowaKoreanLaotianLatvianLebaneseLithuanianLumbeeLuxembourgerMacedonianMalaysianMalteseMarshalleseMenomineeMexicanMexican American IndianMongolianMoroccanNative HawaiianNavajoNepaleseNew ZealanderNicaraguanNigerianNorthern EuropeanNorwegianOkinawanOsageOttawaPaiutePakistaniPalestinianPanamanianParaguayanPennsylvania GermanPeruvianPimaPolishPortuguesePotawatomiPuebloPuerto RicanPuget Sound SalishRomanianRussianSalvadoranSamoanScandinavianScotch-IrishScottishSeminoleSenegaleseSerbianShoshoneSierra LeoneanSiouxSlavicSlovakSloveneSomaliSouth AfricanSouth AmericanSouth American IndianSoviet UnionSpaniardSpanishSpanish AmericanSpanish American IndianSri LankanSubsaharan AfricanSudaneseSwedishSwissSyrianTaiwaneseThaiTlingit-HaidaTohono O'OdhamTonganTrinidadian and TobagonianTsimshianTurkishU.S. Virgin IslanderUgandanUkrainianUruguayanUteVenezuelanVietnameseWelshWest IndianYakamaYaquiYugoslavianYumanYup'ikZimbabwean
Immigration
NonimmigrantsImmigrantsAfghanistanAfricaAlbaniaArgentinaArmeniaAsiaAustraliaAustriaBahamasBangladeshBarbadosBelarusBelgiumBelizeBoliviaBosnia and HerzegovinaBrazilBulgariaBurma/MyanmarCabo VerdeCambodiaCameroonCanadaCaribbeanCentral AmericaChileChinaColombiaCongoCosta RicaCroatiaCubaCzechoslovakiaDenmarkDominicaDominican RepublicEastern AfricaEastern AsiaEastern EuropeEcuadorEgyptEl SalvadorEnglandEritreaEthiopiaEuropeFijiFranceGermanyGhanaGreeceGrenadaGuatemalaGuyanaHaitiHondurasHong KongHungaryIndiaIndonesiaIranIraqIrelandIsraelItalyJamaicaJapanJordanKazakhstanKenyaKoreaKuwaitLaosLatin AmericaLatviaLebanonLiberiaLithuaniaMalaysiaMexicoMicronesiaMiddle AfricaMoldovaMoroccoNepalNetherlandsNicaraguaNigeriaNorth AmericaNorth MacedoniaNorthern AfricaNorthern EuropeNorwayOceaniaPakistanPanamaPeruPhilippinesPolandPortugalRomaniaRussiaSaudi ArabiaScotlandSenegalSerbiaSierra LeoneSingaporeSomaliaSouth AfricaSouth AmericaSouth Central AsiaSouth Eastern AsiaSouthern EuropeSpainSri LankaSt. Vincent and the GrenadinesSudanSwedenSwitzerlandSyriaTaiwanThailandTrinidad and TobagoTurkeyUgandaUkraineUruguayUzbekistanVenezuelaVietnamWest IndiesWestern AfricaWestern AsiaWestern EuropeYemenZaireZimbabweAzores
Disability Age Under 5
Income
Poverty
Unemployment
Labor Participation
Family Structure
Vehicle Availability
Education Level
Disability

Liberian Disability Age Under 5
Fair

1.3%
DISABILITY | AGE UNDER 5
24.0/ 100
METRIC RATING
203rd/ 347
METRIC RANK

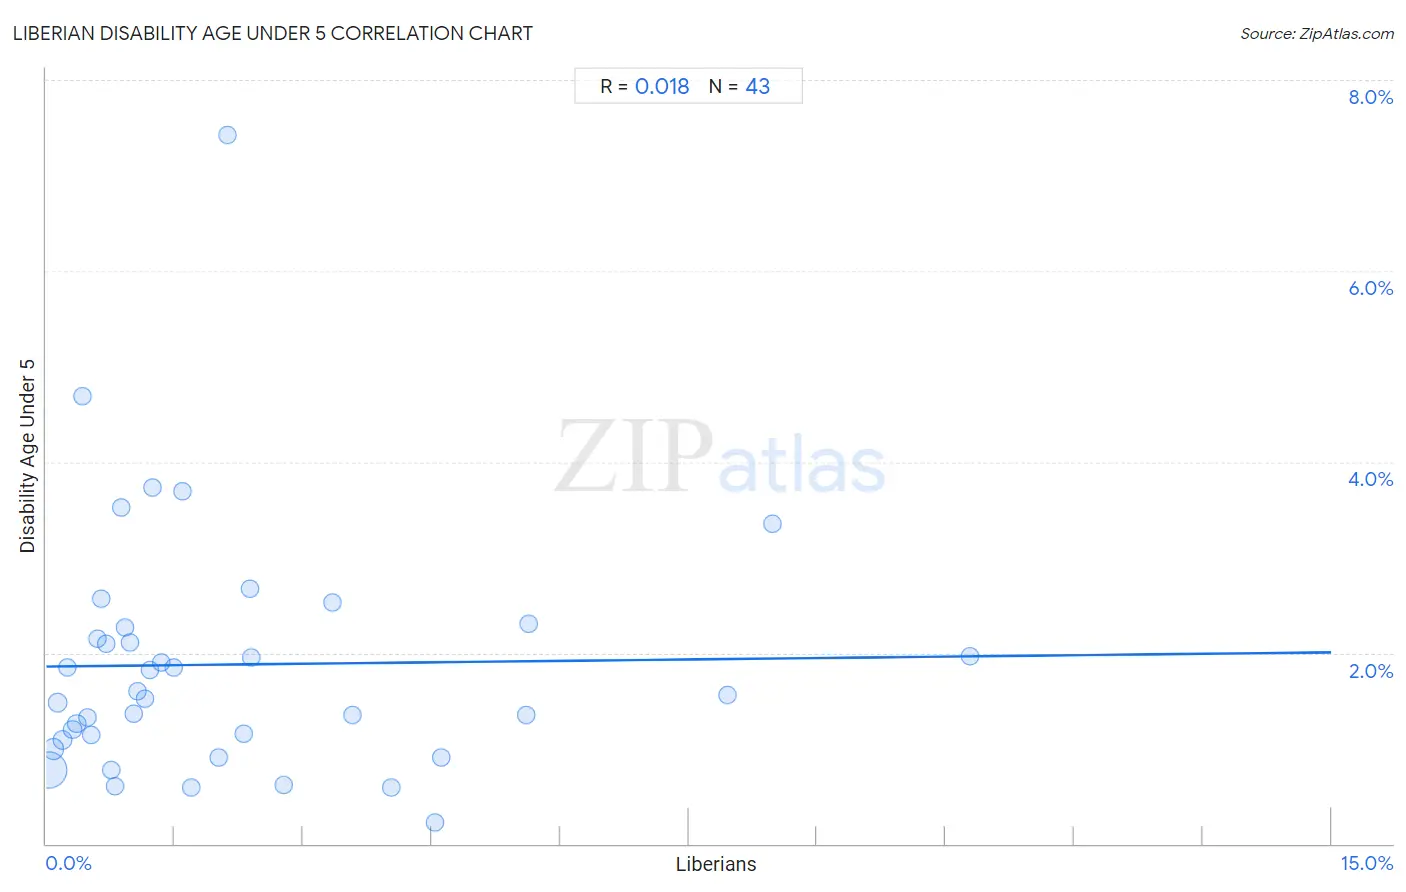
Liberian Disability Age Under 5 Correlation Chart

The statistical analysis conducted on geographies consisting of 88,330,984 people shows no correlation between the proportion of Liberians and percentage of population with a disability under the age of 5 in the United States with a correlation coefficient (R) of 0.018 and weighted average of 1.3%. On average, for every 1% (one percent) increase in Liberians within a typical geography, there is an increase of 0.0098% in percentage of population with a disability under the age of 5.
Liberian Disability Age Under 5
It is essential to understand that the correlation between the percentage of Liberians and percentage of population with a disability under the age of 5 does not imply a direct cause-and-effect relationship. It remains uncertain whether the presence of Liberians influences an upward or downward trend in the level of percentage of population with a disability under the age of 5 within an area, or if Liberians simply ended up residing in those areas with higher or lower levels of percentage of population with a disability under the age of 5 due to other factors.

Demographics Similar to Liberians by Disability Age Under 5

In terms of disability age under 5, the demographic groups most similar to Liberians are Arapaho (1.3%, a difference of 0.020%), Immigrants from Europe (1.3%, a difference of 0.050%), Immigrants from Italy (1.3%, a difference of 0.16%), Romanian (1.3%, a difference of 0.18%), and Immigrants from Poland (1.3%, a difference of 0.20%).
DemographicsRating | RankDisability Age Under 5
Immigrants from Belgium
31.4
/100
|
#196
Fair
1.3%
Immigrants from Somalia
31.3
/100
|
#197
Fair
1.3%
Immigrants from Norway
31.1
/100
|
#198
Fair
1.3%
Jamaicans
30.7
/100
|
#199
Fair
1.3%
Immigrants from Lithuania
27.2
/100
|
#200
Fair
1.3%
Immigrants from Italy
25.4
/100
|
#201
Fair
1.3%
Arapaho
24.1
/100
|
#202
Fair
1.3%
Liberians
24.0
/100
|
#203
Fair
1.3%
Immigrants from Europe
23.6
/100
|
#204
Fair
1.3%
Romanians
22.5
/100
|
#205
Fair
1.3%
Immigrants from Poland
22.4
/100
|
#206
Fair
1.3%
Nigerians
21.2
/100
|
#207
Fair
1.3%
Mexicans
20.8
/100
|
#208
Fair
1.3%
Bulgarians
19.5
/100
|
#209
Poor
1.3%
Pakistanis
19.4
/100
|
#210
Poor
1.3%

Liberian Disability Age Under 5 Correlation Summary

MeasurementLiberian DataDisability Age Under 5 Data
Minimum0.024%0.22%
Maximum10.8%7.4%
Range10.8%7.2%
Mean2.2%1.9%
Median1.2%1.6%
Interquartile 25% (IQ1)0.60%1.1%
Interquartile 75% (IQ3)2.8%2.3%
Interquartile Range (IQR)2.2%1.2%
Standard Deviation (Sample)2.4%1.3%
Standard Deviation (Population)2.4%1.3%

Correlation Details

Liberian PercentileSample SizeDisability Age Under 5
[
0.0%
-
0.5%
]
0.024%
62,148,9260.77%
[
0.0%
-
0.5%
]
0.085%
10,468,3080.99%
[
0.0%
-
0.5%
]
0.14%
3,383,5201.5%
[
0.0%
-
0.5%
]
0.19%
4,199,7501.1%
[
0.0%
-
0.5%
]
0.25%
744,5481.8%
[
0.0%
-
0.5%
]
0.31%
3,241,0401.2%
[
0.0%
-
0.5%
]
0.36%
818,6551.3%
[
0.0%
-
0.5%
]
0.42%
128,0184.7%
[
0.0%
-
0.5%
]
0.48%
428,1441.3%
[
0.5%
-
1.0%
]
0.52%
398,5921.1%
[
0.5%
-
1.0%
]
0.60%
194,6972.1%
[
0.5%
-
1.0%
]
0.64%
121,1672.6%
[
0.5%
-
1.0%
]
0.71%
162,7432.1%
[
0.5%
-
1.0%
]
0.75%
246,6640.77%
[
0.5%
-
1.0%
]
0.81%
195,6630.61%
[
0.5%
-
1.0%
]
0.87%
94,4843.5%
[
0.5%
-
1.0%
]
0.92%
84,1752.3%
[
0.5%
-
1.0%
]
0.98%
115,6252.1%
[
1.0%
-
1.5%
]
1.02%
42,6291.4%
[
1.0%
-
1.5%
]
1.07%
43,6671.6%
[
1.0%
-
1.5%
]
1.15%
189,7151.5%
[
1.0%
-
1.5%
]
1.21%
71,6271.8%
[
1.0%
-
1.5%
]
1.25%
92,9223.7%
[
1.0%
-
1.5%
]
1.34%
25,0591.9%
[
1.0%
-
1.5%
]
1.48%
61,5991.8%
[
1.5%
-
2.0%
]
1.59%
4,2223.7%
[
1.5%
-
2.0%
]
1.69%
133,1570.59%
[
2.0%
-
2.5%
]
2.02%
127,3190.91%
[
2.0%
-
2.5%
]
2.11%
3,2647.4%
[
2.0%
-
2.5%
]
2.30%
31,7561.2%
[
2.0%
-
2.5%
]
2.38%
28,9052.7%
[
2.0%
-
2.5%
]
2.40%
14,9601.9%
[
2.5%
-
3.0%
]
2.77%
23,4460.61%
[
3.0%
-
3.5%
]
3.34%
31,8122.5%
[
3.5%
-
4.0%
]
3.57%
12,2771.4%
[
4.0%
-
4.5%
]
4.03%
32,9120.59%
[
4.5%
-
5.0%
]
4.54%
84,9510.22%
[
4.5%
-
5.0%
]
4.61%
8,2440.90%
[
5.5%
-
6.0%
]
5.60%
22,4931.3%
[
5.5%
-
6.0%
]
5.63%
21,6202.3%
[
7.5%
-
8.0%
]
7.96%
32,9671.6%
[
8.0%
-
8.5%
]
8.47%
10,6823.4%
[
10.5%
-
11.0%
]
10.79%
4,0602.0%