Immigrants from Southern Europe Disability Age Under 5

COMPARE

Immigrants from Southern Europe
Race
Ancestry
AfghanAfricanAlaska NativeAlaskan AthabascanAlbanianAleutAlsatianAmericanApacheArabArapahoArgentineanArmenianAssyrian/Chaldean/SyriacAustralianAustrianBahamianBangladeshiBarbadianBasqueBelgianBelizeanBermudanBhutaneseBlackfeetBolivianBrazilianBritishBritish West IndianBulgarianBurmeseCajunCambodianCanadianCape VerdeanCarpatho RusynCelticCentral AmericanCentral American IndianCherokeeCheyenneChickasawChileanChineseChippewaChoctawColombianColvilleComancheCosta RicanCreeCreekCroatianCrowCubanCypriotCzechCzechoslovakianDanishDelawareDominicanDutchDutch West IndianEastern EuropeanEcuadorianEgyptianEnglishEstonianEthiopianEuropeanFijianFilipinoFinnishFrenchFrench American IndianFrench CanadianGermanGerman RussianGhanaianGreekGuamanian/ChamorroGuatemalanGuyaneseHaitianHmongHonduranHopiHoumaHungarianIcelanderIndian (Asian)IndonesianInupiatIranianIraqiIrishIroquoisIsraeliItalianJamaicanJapaneseJordanianKenyanKiowaKoreanLaotianLatvianLebaneseLiberianLithuanianLumbeeLuxembourgerMacedonianMalaysianMalteseMarshalleseMenomineeMexicanMexican American IndianMongolianMoroccanNative HawaiianNavajoNepaleseNew ZealanderNicaraguanNigerianNorthern EuropeanNorwegianOkinawanOsageOttawaPaiutePakistaniPalestinianPanamanianParaguayanPennsylvania GermanPeruvianPimaPolishPortuguesePotawatomiPuebloPuerto RicanPuget Sound SalishRomanianRussianSalvadoranSamoanScandinavianScotch-IrishScottishSeminoleSenegaleseSerbianShoshoneSierra LeoneanSiouxSlavicSlovakSloveneSomaliSouth AfricanSouth AmericanSouth American IndianSoviet UnionSpaniardSpanishSpanish AmericanSpanish American IndianSri LankanSubsaharan AfricanSudaneseSwedishSwissSyrianTaiwaneseThaiTlingit-HaidaTohono O'OdhamTonganTrinidadian and TobagonianTsimshianTurkishU.S. Virgin IslanderUgandanUkrainianUruguayanUteVenezuelanVietnameseWelshWest IndianYakamaYaquiYugoslavianYumanYup'ikZimbabwean
Immigration
NonimmigrantsImmigrantsAfghanistanAfricaAlbaniaArgentinaArmeniaAsiaAustraliaAustriaBahamasBangladeshBarbadosBelarusBelgiumBelizeBoliviaBosnia and HerzegovinaBrazilBulgariaBurma/MyanmarCabo VerdeCambodiaCameroonCanadaCaribbeanCentral AmericaChileChinaColombiaCongoCosta RicaCroatiaCubaCzechoslovakiaDenmarkDominicaDominican RepublicEastern AfricaEastern AsiaEastern EuropeEcuadorEgyptEl SalvadorEnglandEritreaEthiopiaEuropeFijiFranceGermanyGhanaGreeceGrenadaGuatemalaGuyanaHaitiHondurasHong KongHungaryIndiaIndonesiaIranIraqIrelandIsraelItalyJamaicaJapanJordanKazakhstanKenyaKoreaKuwaitLaosLatin AmericaLatviaLebanonLiberiaLithuaniaMalaysiaMexicoMicronesiaMiddle AfricaMoldovaMoroccoNepalNetherlandsNicaraguaNigeriaNorth AmericaNorth MacedoniaNorthern AfricaNorthern EuropeNorwayOceaniaPakistanPanamaPeruPhilippinesPolandPortugalRomaniaRussiaSaudi ArabiaScotlandSenegalSerbiaSierra LeoneSingaporeSomaliaSouth AfricaSouth AmericaSouth Central AsiaSouth Eastern AsiaSouthern EuropeSpainSri LankaSt. Vincent and the GrenadinesSudanSwedenSwitzerlandSyriaTaiwanThailandTrinidad and TobagoTurkeyUgandaUkraineUruguayUzbekistanVenezuelaVietnamWest IndiesWestern AfricaWestern AsiaWestern EuropeYemenZaireZimbabweAzores
Select to Compare
Race
Ancestry
AfghanAfricanAlaska NativeAlaskan AthabascanAlbanianAleutAlsatianAmericanApacheArabArapahoArgentineanArmenianAssyrian/Chaldean/SyriacAustralianAustrianBahamianBangladeshiBarbadianBasqueBelgianBelizeanBermudanBhutaneseBlackfeetBolivianBrazilianBritishBritish West IndianBulgarianBurmeseCajunCambodianCanadianCape VerdeanCarpatho RusynCelticCentral AmericanCentral American IndianCherokeeCheyenneChickasawChileanChineseChippewaChoctawColombianColvilleComancheCosta RicanCreeCreekCroatianCrowCubanCypriotCzechCzechoslovakianDanishDelawareDominicanDutchDutch West IndianEastern EuropeanEcuadorianEgyptianEnglishEstonianEthiopianEuropeanFijianFilipinoFinnishFrenchFrench American IndianFrench CanadianGermanGerman RussianGhanaianGreekGuamanian/ChamorroGuatemalanGuyaneseHaitianHmongHonduranHopiHoumaHungarianIcelanderIndian (Asian)IndonesianInupiatIranianIraqiIrishIroquoisIsraeliItalianJamaicanJapaneseJordanianKenyanKiowaKoreanLaotianLatvianLebaneseLiberianLithuanianLumbeeLuxembourgerMacedonianMalaysianMalteseMarshalleseMenomineeMexicanMexican American IndianMongolianMoroccanNative HawaiianNavajoNepaleseNew ZealanderNicaraguanNigerianNorthern EuropeanNorwegianOkinawanOsageOttawaPaiutePakistaniPalestinianPanamanianParaguayanPennsylvania GermanPeruvianPimaPolishPortuguesePotawatomiPuebloPuerto RicanPuget Sound SalishRomanianRussianSalvadoranSamoanScandinavianScotch-IrishScottishSeminoleSenegaleseSerbianShoshoneSierra LeoneanSiouxSlavicSlovakSloveneSomaliSouth AfricanSouth AmericanSouth American IndianSoviet UnionSpaniardSpanishSpanish AmericanSpanish American IndianSri LankanSubsaharan AfricanSudaneseSwedishSwissSyrianTaiwaneseThaiTlingit-HaidaTohono O'OdhamTonganTrinidadian and TobagonianTsimshianTurkishU.S. Virgin IslanderUgandanUkrainianUruguayanUteVenezuelanVietnameseWelshWest IndianYakamaYaquiYugoslavianYumanYup'ikZimbabwean
Immigration
NonimmigrantsImmigrantsAfghanistanAfricaAlbaniaArgentinaArmeniaAsiaAustraliaAustriaBahamasBangladeshBarbadosBelarusBelgiumBelizeBoliviaBosnia and HerzegovinaBrazilBulgariaBurma/MyanmarCabo VerdeCambodiaCameroonCanadaCaribbeanCentral AmericaChileChinaColombiaCongoCosta RicaCroatiaCubaCzechoslovakiaDenmarkDominicaDominican RepublicEastern AfricaEastern AsiaEastern EuropeEcuadorEgyptEl SalvadorEnglandEritreaEthiopiaEuropeFijiFranceGermanyGhanaGreeceGrenadaGuatemalaGuyanaHaitiHondurasHong KongHungaryIndiaIndonesiaIranIraqIrelandIsraelItalyJamaicaJapanJordanKazakhstanKenyaKoreaKuwaitLaosLatin AmericaLatviaLebanonLiberiaLithuaniaMalaysiaMexicoMicronesiaMiddle AfricaMoldovaMoroccoNepalNetherlandsNicaraguaNigeriaNorth AmericaNorth MacedoniaNorthern AfricaNorthern EuropeNorwayOceaniaPakistanPanamaPeruPhilippinesPolandPortugalRomaniaRussiaSaudi ArabiaScotlandSenegalSerbiaSierra LeoneSingaporeSomaliaSouth AfricaSouth AmericaSouth Central AsiaSouth Eastern AsiaSpainSri LankaSt. Vincent and the GrenadinesSudanSwedenSwitzerlandSyriaTaiwanThailandTrinidad and TobagoTurkeyUgandaUkraineUruguayUzbekistanVenezuelaVietnamWest IndiesWestern AfricaWestern AsiaWestern EuropeYemenZaireZimbabweAzores
Disability Age Under 5
Income
Poverty
Unemployment
Labor Participation
Family Structure
Vehicle Availability
Education Level
Disability

Immigrants from Southern Europe Disability Age Under 5
Tragic

1.4%
DISABILITY | AGE UNDER 5
0.3/ 100
METRIC RATING
259th/ 347
METRIC RANK

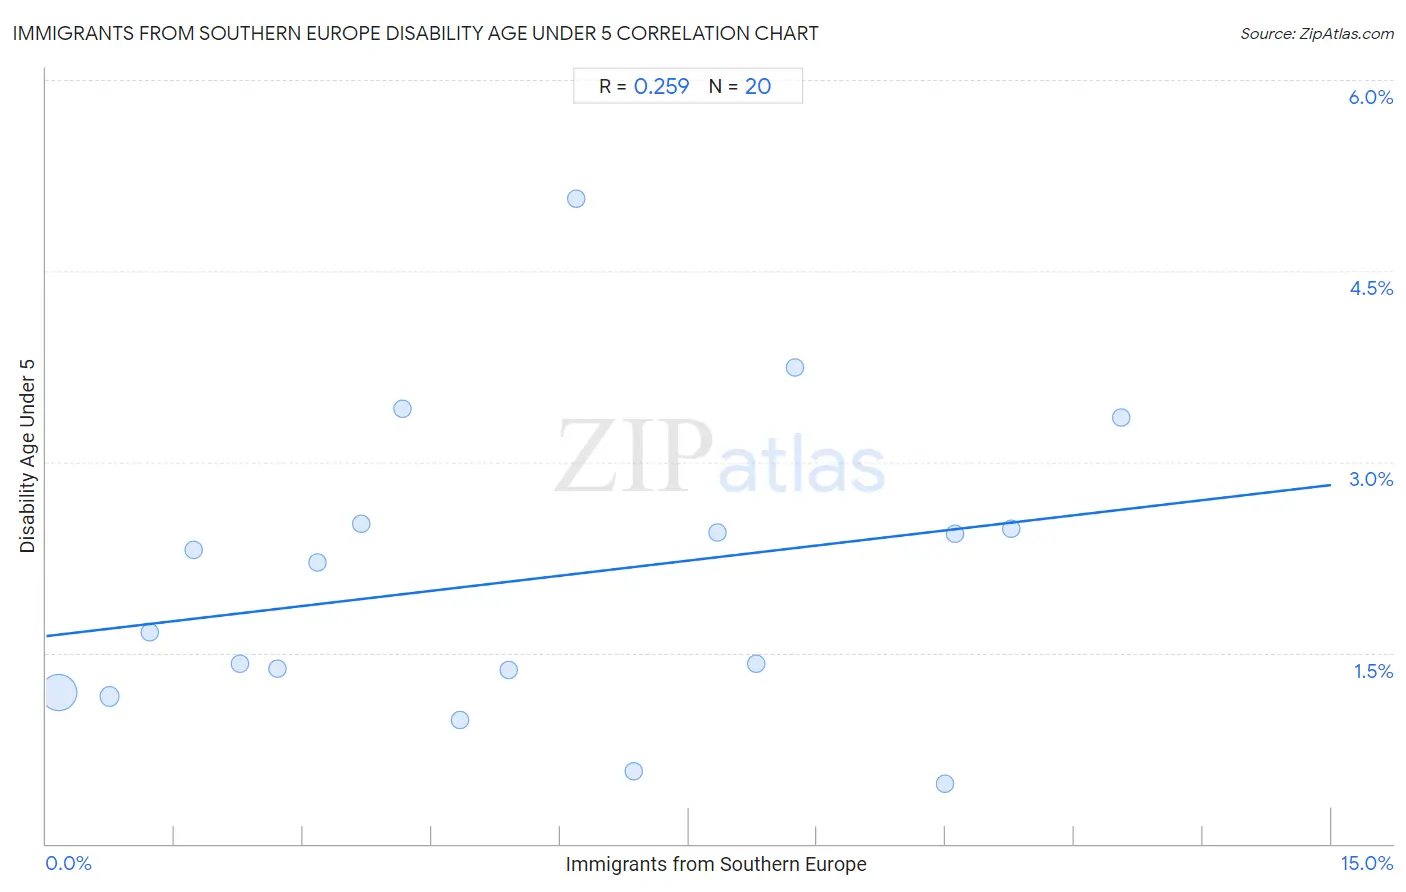
Immigrants from Southern Europe Disability Age Under 5 Correlation Chart

The statistical analysis conducted on geographies consisting of 213,620,900 people shows a weak positive correlation between the proportion of Immigrants from Southern Europe and percentage of population with a disability under the age of 5 in the United States with a correlation coefficient (R) of 0.259 and weighted average of 1.4%. On average, for every 1% (one percent) increase in Immigrants from Southern Europe within a typical geography, there is an increase of 0.079% in percentage of population with a disability under the age of 5.
Immigrants from Southern Europe Disability Age Under 5
It is essential to understand that the correlation between the percentage of Immigrants from Southern Europe and percentage of population with a disability under the age of 5 does not imply a direct cause-and-effect relationship. It remains uncertain whether the presence of Immigrants from Southern Europe influences an upward or downward trend in the level of percentage of population with a disability under the age of 5 within an area, or if Immigrants from Southern Europe simply ended up residing in those areas with higher or lower levels of percentage of population with a disability under the age of 5 due to other factors.

Demographics Similar to Immigrants from Southern Europe by Disability Age Under 5

In terms of disability age under 5, the demographic groups most similar to Immigrants from Southern Europe are Costa Rican (1.4%, a difference of 0.16%), Slavic (1.4%, a difference of 0.21%), Slovene (1.4%, a difference of 0.34%), Immigrants from Netherlands (1.4%, a difference of 0.88%), and Immigrants from Dominica (1.4%, a difference of 1.0%).
DemographicsRating | RankDisability Age Under 5
Immigrants from Scotland
0.9
/100
|
#252
Tragic
1.4%
Australians
0.7
/100
|
#253
Tragic
1.4%
Immigrants from Brazil
0.7
/100
|
#254
Tragic
1.4%
Immigrants from Liberia
0.6
/100
|
#255
Tragic
1.4%
Immigrants from Western Europe
0.5
/100
|
#256
Tragic
1.4%
Slovenes
0.3
/100
|
#257
Tragic
1.4%
Costa Ricans
0.3
/100
|
#258
Tragic
1.4%
Immigrants from Southern Europe
0.3
/100
|
#259
Tragic
1.4%
Slavs
0.3
/100
|
#260
Tragic
1.4%
Immigrants from Netherlands
0.2
/100
|
#261
Tragic
1.4%
Immigrants from Dominica
0.2
/100
|
#262
Tragic
1.4%
Spanish
0.2
/100
|
#263
Tragic
1.4%
Yugoslavians
0.1
/100
|
#264
Tragic
1.4%
Carpatho Rusyns
0.1
/100
|
#265
Tragic
1.4%
Immigrants from Germany
0.1
/100
|
#266
Tragic
1.4%

Immigrants from Southern Europe Disability Age Under 5 Correlation Summary

MeasurementImmigrants from Southern Europe DataDisability Age Under 5 Data
Minimum0.14%0.48%
Maximum12.6%5.1%
Range12.4%4.6%
Mean5.6%2.1%
Median5.1%1.9%
Interquartile 25% (IQ1)2.5%1.3%
Interquartile 75% (IQ3)8.5%2.5%
Interquartile Range (IQR)6.0%1.2%
Standard Deviation (Sample)3.8%1.2%
Standard Deviation (Population)3.7%1.1%

Correlation Details

Immigrants from Southern Europe PercentileSample SizeDisability Age Under 5
[
0.0%
-
0.5%
]
0.14%
184,842,6921.2%
[
0.5%
-
1.0%
]
0.74%
20,742,4221.2%
[
1.0%
-
1.5%
]
1.21%
4,129,9141.7%
[
1.5%
-
2.0%
]
1.72%
1,644,4042.3%
[
2.0%
-
2.5%
]
2.26%
546,5761.4%
[
2.5%
-
3.0%
]
2.70%
640,6651.4%
[
3.0%
-
3.5%
]
3.16%
149,3502.2%
[
3.5%
-
4.0%
]
3.67%
221,4892.5%
[
4.0%
-
4.5%
]
4.16%
39,7293.4%
[
4.5%
-
5.0%
]
4.83%
138,4200.97%
[
5.0%
-
5.5%
]
5.40%
59,4871.4%
[
6.0%
-
6.5%
]
6.19%
69,0435.1%
[
6.5%
-
7.0%
]
6.86%
38,7560.57%
[
7.5%
-
8.0%
]
7.83%
100,6202.4%
[
8.0%
-
8.5%
]
8.29%
16,2861.4%
[
8.5%
-
9.0%
]
8.74%
20,8833.7%
[
10.0%
-
10.5%
]
10.50%
56,6960.48%
[
10.5%
-
11.0%
]
10.61%
12,4652.4%
[
11.0%
-
11.5%
]
11.27%
124,1962.5%
[
12.5%
-
13.0%
]
12.55%
26,8073.4%