Mongolian Disability Age Under 5

COMPARE

Mongolian
Race
Ancestry
AfghanAfricanAlaska NativeAlaskan AthabascanAlbanianAleutAlsatianAmericanApacheArabArapahoArgentineanArmenianAssyrian/Chaldean/SyriacAustralianAustrianBahamianBangladeshiBarbadianBasqueBelgianBelizeanBermudanBhutaneseBlackfeetBolivianBrazilianBritishBritish West IndianBulgarianBurmeseCajunCambodianCanadianCape VerdeanCarpatho RusynCelticCentral AmericanCentral American IndianCherokeeCheyenneChickasawChileanChineseChippewaChoctawColombianColvilleComancheCosta RicanCreeCreekCroatianCrowCubanCypriotCzechCzechoslovakianDanishDelawareDominicanDutchDutch West IndianEastern EuropeanEcuadorianEgyptianEnglishEstonianEthiopianEuropeanFijianFilipinoFinnishFrenchFrench American IndianFrench CanadianGermanGerman RussianGhanaianGreekGuamanian/ChamorroGuatemalanGuyaneseHaitianHmongHonduranHopiHoumaHungarianIcelanderIndian (Asian)IndonesianInupiatIranianIraqiIrishIroquoisIsraeliItalianJamaicanJapaneseJordanianKenyanKiowaKoreanLaotianLatvianLebaneseLiberianLithuanianLumbeeLuxembourgerMacedonianMalaysianMalteseMarshalleseMenomineeMexicanMexican American IndianMongolianMoroccanNative HawaiianNavajoNepaleseNew ZealanderNicaraguanNigerianNorthern EuropeanNorwegianOkinawanOsageOttawaPaiutePakistaniPalestinianPanamanianParaguayanPennsylvania GermanPeruvianPimaPolishPortuguesePotawatomiPuebloPuerto RicanPuget Sound SalishRomanianRussianSalvadoranSamoanScandinavianScotch-IrishScottishSeminoleSenegaleseSerbianShoshoneSierra LeoneanSiouxSlavicSlovakSloveneSomaliSouth AfricanSouth AmericanSouth American IndianSoviet UnionSpaniardSpanishSpanish AmericanSpanish American IndianSri LankanSubsaharan AfricanSudaneseSwedishSwissSyrianTaiwaneseThaiTlingit-HaidaTohono O'OdhamTonganTrinidadian and TobagonianTsimshianTurkishU.S. Virgin IslanderUgandanUkrainianUruguayanUteVenezuelanVietnameseWelshWest IndianYakamaYaquiYugoslavianYumanYup'ikZimbabwean
Immigration
NonimmigrantsImmigrantsAfghanistanAfricaAlbaniaArgentinaArmeniaAsiaAustraliaAustriaBahamasBangladeshBarbadosBelarusBelgiumBelizeBoliviaBosnia and HerzegovinaBrazilBulgariaBurma/MyanmarCabo VerdeCambodiaCameroonCanadaCaribbeanCentral AmericaChileChinaColombiaCongoCosta RicaCroatiaCubaCzechoslovakiaDenmarkDominicaDominican RepublicEastern AfricaEastern AsiaEastern EuropeEcuadorEgyptEl SalvadorEnglandEritreaEthiopiaEuropeFijiFranceGermanyGhanaGreeceGrenadaGuatemalaGuyanaHaitiHondurasHong KongHungaryIndiaIndonesiaIranIraqIrelandIsraelItalyJamaicaJapanJordanKazakhstanKenyaKoreaKuwaitLaosLatin AmericaLatviaLebanonLiberiaLithuaniaMalaysiaMexicoMicronesiaMiddle AfricaMoldovaMoroccoNepalNetherlandsNicaraguaNigeriaNorth AmericaNorth MacedoniaNorthern AfricaNorthern EuropeNorwayOceaniaPakistanPanamaPeruPhilippinesPolandPortugalRomaniaRussiaSaudi ArabiaScotlandSenegalSerbiaSierra LeoneSingaporeSomaliaSouth AfricaSouth AmericaSouth Central AsiaSouth Eastern AsiaSouthern EuropeSpainSri LankaSt. Vincent and the GrenadinesSudanSwedenSwitzerlandSyriaTaiwanThailandTrinidad and TobagoTurkeyUgandaUkraineUruguayUzbekistanVenezuelaVietnamWest IndiesWestern AfricaWestern AsiaWestern EuropeYemenZaireZimbabweAzores
Select to Compare
Race
Ancestry
AfghanAfricanAlaska NativeAlaskan AthabascanAlbanianAleutAlsatianAmericanApacheArabArapahoArgentineanArmenianAssyrian/Chaldean/SyriacAustralianAustrianBahamianBangladeshiBarbadianBasqueBelgianBelizeanBermudanBhutaneseBlackfeetBolivianBrazilianBritishBritish West IndianBulgarianBurmeseCajunCambodianCanadianCape VerdeanCarpatho RusynCelticCentral AmericanCentral American IndianCherokeeCheyenneChickasawChileanChineseChippewaChoctawColombianColvilleComancheCosta RicanCreeCreekCroatianCrowCubanCypriotCzechCzechoslovakianDanishDelawareDominicanDutchDutch West IndianEastern EuropeanEcuadorianEgyptianEnglishEstonianEthiopianEuropeanFijianFilipinoFinnishFrenchFrench American IndianFrench CanadianGermanGerman RussianGhanaianGreekGuamanian/ChamorroGuatemalanGuyaneseHaitianHmongHonduranHopiHoumaHungarianIcelanderIndian (Asian)IndonesianInupiatIranianIraqiIrishIroquoisIsraeliItalianJamaicanJapaneseJordanianKenyanKiowaKoreanLaotianLatvianLebaneseLiberianLithuanianLumbeeLuxembourgerMacedonianMalaysianMalteseMarshalleseMenomineeMexicanMexican American IndianMoroccanNative HawaiianNavajoNepaleseNew ZealanderNicaraguanNigerianNorthern EuropeanNorwegianOkinawanOsageOttawaPaiutePakistaniPalestinianPanamanianParaguayanPennsylvania GermanPeruvianPimaPolishPortuguesePotawatomiPuebloPuerto RicanPuget Sound SalishRomanianRussianSalvadoranSamoanScandinavianScotch-IrishScottishSeminoleSenegaleseSerbianShoshoneSierra LeoneanSiouxSlavicSlovakSloveneSomaliSouth AfricanSouth AmericanSouth American IndianSoviet UnionSpaniardSpanishSpanish AmericanSpanish American IndianSri LankanSubsaharan AfricanSudaneseSwedishSwissSyrianTaiwaneseThaiTlingit-HaidaTohono O'OdhamTonganTrinidadian and TobagonianTsimshianTurkishU.S. Virgin IslanderUgandanUkrainianUruguayanUteVenezuelanVietnameseWelshWest IndianYakamaYaquiYugoslavianYumanYup'ikZimbabwean
Immigration
NonimmigrantsImmigrantsAfghanistanAfricaAlbaniaArgentinaArmeniaAsiaAustraliaAustriaBahamasBangladeshBarbadosBelarusBelgiumBelizeBoliviaBosnia and HerzegovinaBrazilBulgariaBurma/MyanmarCabo VerdeCambodiaCameroonCanadaCaribbeanCentral AmericaChileChinaColombiaCongoCosta RicaCroatiaCubaCzechoslovakiaDenmarkDominicaDominican RepublicEastern AfricaEastern AsiaEastern EuropeEcuadorEgyptEl SalvadorEnglandEritreaEthiopiaEuropeFijiFranceGermanyGhanaGreeceGrenadaGuatemalaGuyanaHaitiHondurasHong KongHungaryIndiaIndonesiaIranIraqIrelandIsraelItalyJamaicaJapanJordanKazakhstanKenyaKoreaKuwaitLaosLatin AmericaLatviaLebanonLiberiaLithuaniaMalaysiaMexicoMicronesiaMiddle AfricaMoldovaMoroccoNepalNetherlandsNicaraguaNigeriaNorth AmericaNorth MacedoniaNorthern AfricaNorthern EuropeNorwayOceaniaPakistanPanamaPeruPhilippinesPolandPortugalRomaniaRussiaSaudi ArabiaScotlandSenegalSerbiaSierra LeoneSingaporeSomaliaSouth AfricaSouth AmericaSouth Central AsiaSouth Eastern AsiaSouthern EuropeSpainSri LankaSt. Vincent and the GrenadinesSudanSwedenSwitzerlandSyriaTaiwanThailandTrinidad and TobagoTurkeyUgandaUkraineUruguayUzbekistanVenezuelaVietnamWest IndiesWestern AfricaWestern AsiaWestern EuropeYemenZaireZimbabweAzores
Disability Age Under 5
Income
Poverty
Unemployment
Labor Participation
Family Structure
Vehicle Availability
Education Level
Disability

Mongolian Disability Age Under 5
Exceptional

1.1%
DISABILITY | AGE UNDER 5
96.6/ 100
METRIC RATING
96th/ 347
METRIC RANK

Mongolian Disability Age Under 5 Correlation Chart

The statistical analysis conducted on geographies consisting of 103,209,852 people shows a substantial positive correlation between the proportion of Mongolians and percentage of population with a disability under the age of 5 in the United States with a correlation coefficient (R) of 0.544 and weighted average of 1.1%. On average, for every 1% (one percent) increase in Mongolians within a typical geography, there is an increase of 2.1% in percentage of population with a disability under the age of 5.
Mongolian Disability Age Under 5
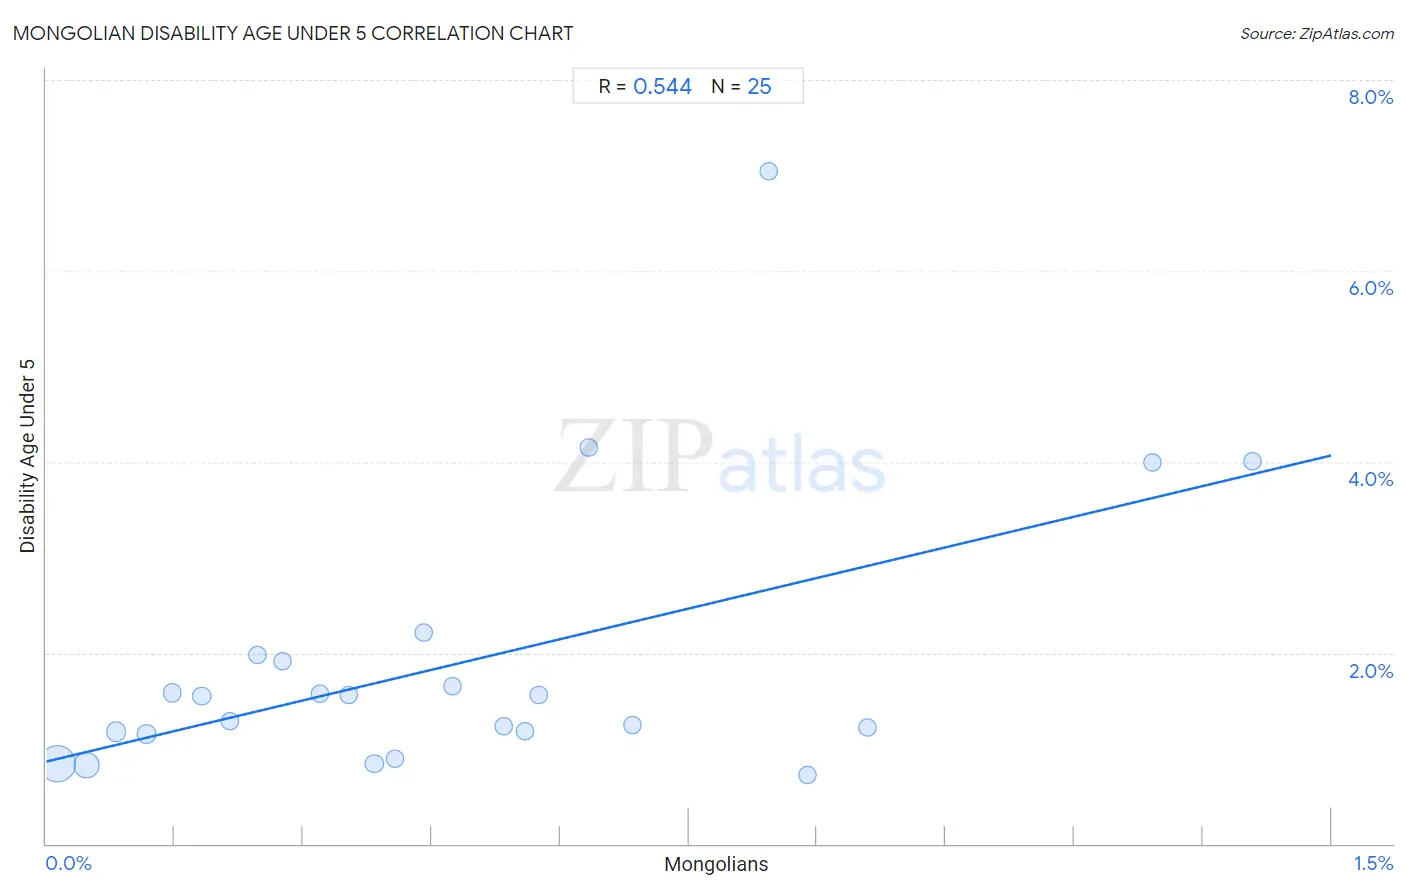
It is essential to understand that the correlation between the percentage of Mongolians and percentage of population with a disability under the age of 5 does not imply a direct cause-and-effect relationship. It remains uncertain whether the presence of Mongolians influences an upward or downward trend in the level of percentage of population with a disability under the age of 5 within an area, or if Mongolians simply ended up residing in those areas with higher or lower levels of percentage of population with a disability under the age of 5 due to other factors.

Demographics Similar to Mongolians by Disability Age Under 5

In terms of disability age under 5, the demographic groups most similar to Mongolians are Immigrants from Moldova (1.1%, a difference of 0.10%), Immigrants from Iraq (1.1%, a difference of 0.10%), Immigrants from South Eastern Asia (1.1%, a difference of 0.11%), Sri Lankan (1.1%, a difference of 0.16%), and Spanish American (1.1%, a difference of 0.22%).
DemographicsRating | RankDisability Age Under 5
Ethiopians
97.2
/100
|
#89
Exceptional
1.1%
Chinese
97.2
/100
|
#90
Exceptional
1.1%
Albanians
97.2
/100
|
#91
Exceptional
1.1%
Immigrants from Cuba
97.0
/100
|
#92
Exceptional
1.1%
Spanish Americans
96.9
/100
|
#93
Exceptional
1.1%
Sri Lankans
96.8
/100
|
#94
Exceptional
1.1%
Immigrants from Moldova
96.8
/100
|
#95
Exceptional
1.1%
Mongolians
96.6
/100
|
#96
Exceptional
1.1%
Immigrants from Iraq
96.5
/100
|
#97
Exceptional
1.1%
Immigrants from South Eastern Asia
96.5
/100
|
#98
Exceptional
1.1%
Dominicans
96.3
/100
|
#99
Exceptional
1.1%
Nicaraguans
96.3
/100
|
#100
Exceptional
1.1%
Immigrants from Uganda
96.1
/100
|
#101
Exceptional
1.1%
Immigrants from Morocco
96.0
/100
|
#102
Exceptional
1.2%
Immigrants from Nicaragua
96.0
/100
|
#103
Exceptional
1.2%

Mongolian Disability Age Under 5 Correlation Summary

MeasurementMongolian DataDisability Age Under 5 Data
Minimum0.014%0.73%
Maximum1.4%7.0%
Range1.4%6.3%
Mean0.48%1.9%
Median0.41%1.5%
Interquartile 25% (IQ1)0.20%1.2%
Interquartile 75% (IQ3)0.66%1.9%
Interquartile Range (IQR)0.46%0.78%
Standard Deviation (Sample)0.37%1.4%
Standard Deviation (Population)0.36%1.4%

Correlation Details

Mongolian PercentileSample SizeDisability Age Under 5
[
0.0%
-
0.5%
]
0.014%
66,214,8210.83%
[
0.0%
-
0.5%
]
0.047%
24,552,4590.82%
[
0.0%
-
0.5%
]
0.082%
5,265,0691.2%
[
0.0%
-
0.5%
]
0.12%
2,502,7891.2%
[
0.0%
-
0.5%
]
0.15%
1,612,7681.6%
[
0.0%
-
0.5%
]
0.18%
968,8031.5%
[
0.0%
-
0.5%
]
0.21%
372,6911.3%
[
0.0%
-
0.5%
]
0.25%
348,5062.0%
[
0.0%
-
0.5%
]
0.28%
147,5731.9%
[
0.0%
-
0.5%
]
0.32%
262,3011.6%
[
0.0%
-
0.5%
]
0.35%
245,5611.6%
[
0.0%
-
0.5%
]
0.38%
215,6760.84%
[
0.0%
-
0.5%
]
0.41%
97,9400.90%
[
0.0%
-
0.5%
]
0.44%
82,0592.2%
[
0.0%
-
0.5%
]
0.47%
36,9171.7%
[
0.5%
-
1.0%
]
0.53%
59,4001.2%
[
0.5%
-
1.0%
]
0.56%
10,3841.2%
[
0.5%
-
1.0%
]
0.58%
2,0851.6%
[
0.5%
-
1.0%
]
0.63%
60,4804.2%
[
0.5%
-
1.0%
]
0.68%
84,2601.2%
[
0.5%
-
1.0%
]
0.84%
9497.0%
[
0.5%
-
1.0%
]
0.89%
18,4610.73%
[
0.5%
-
1.0%
]
0.96%
7,9231.2%
[
1.0%
-
1.5%
]
1.29%
23,1504.0%
[
1.0%
-
1.5%
]
1.41%
16,8274.0%