Immigrants from Dominica Disability Age Under 5

COMPARE

Immigrants from Dominica
Race
Ancestry
AfghanAfricanAlaska NativeAlaskan AthabascanAlbanianAleutAlsatianAmericanApacheArabArapahoArgentineanArmenianAssyrian/Chaldean/SyriacAustralianAustrianBahamianBangladeshiBarbadianBasqueBelgianBelizeanBermudanBhutaneseBlackfeetBolivianBrazilianBritishBritish West IndianBulgarianBurmeseCajunCambodianCanadianCape VerdeanCarpatho RusynCelticCentral AmericanCentral American IndianCherokeeCheyenneChickasawChileanChineseChippewaChoctawColombianColvilleComancheCosta RicanCreeCreekCroatianCrowCubanCypriotCzechCzechoslovakianDanishDelawareDominicanDutchDutch West IndianEastern EuropeanEcuadorianEgyptianEnglishEstonianEthiopianEuropeanFijianFilipinoFinnishFrenchFrench American IndianFrench CanadianGermanGerman RussianGhanaianGreekGuamanian/ChamorroGuatemalanGuyaneseHaitianHmongHonduranHopiHoumaHungarianIcelanderIndian (Asian)IndonesianInupiatIranianIraqiIrishIroquoisIsraeliItalianJamaicanJapaneseJordanianKenyanKiowaKoreanLaotianLatvianLebaneseLiberianLithuanianLumbeeLuxembourgerMacedonianMalaysianMalteseMarshalleseMenomineeMexicanMexican American IndianMongolianMoroccanNative HawaiianNavajoNepaleseNew ZealanderNicaraguanNigerianNorthern EuropeanNorwegianOkinawanOsageOttawaPaiutePakistaniPalestinianPanamanianParaguayanPennsylvania GermanPeruvianPimaPolishPortuguesePotawatomiPuebloPuerto RicanPuget Sound SalishRomanianRussianSalvadoranSamoanScandinavianScotch-IrishScottishSeminoleSenegaleseSerbianShoshoneSierra LeoneanSiouxSlavicSlovakSloveneSomaliSouth AfricanSouth AmericanSouth American IndianSoviet UnionSpaniardSpanishSpanish AmericanSpanish American IndianSri LankanSubsaharan AfricanSudaneseSwedishSwissSyrianTaiwaneseThaiTlingit-HaidaTohono O'OdhamTonganTrinidadian and TobagonianTsimshianTurkishU.S. Virgin IslanderUgandanUkrainianUruguayanUteVenezuelanVietnameseWelshWest IndianYakamaYaquiYugoslavianYumanYup'ikZimbabwean
Immigration
NonimmigrantsImmigrantsAfghanistanAfricaAlbaniaArgentinaArmeniaAsiaAustraliaAustriaBahamasBangladeshBarbadosBelarusBelgiumBelizeBoliviaBosnia and HerzegovinaBrazilBulgariaBurma/MyanmarCabo VerdeCambodiaCameroonCanadaCaribbeanCentral AmericaChileChinaColombiaCongoCosta RicaCroatiaCubaCzechoslovakiaDenmarkDominicaDominican RepublicEastern AfricaEastern AsiaEastern EuropeEcuadorEgyptEl SalvadorEnglandEritreaEthiopiaEuropeFijiFranceGermanyGhanaGreeceGrenadaGuatemalaGuyanaHaitiHondurasHong KongHungaryIndiaIndonesiaIranIraqIrelandIsraelItalyJamaicaJapanJordanKazakhstanKenyaKoreaKuwaitLaosLatin AmericaLatviaLebanonLiberiaLithuaniaMalaysiaMexicoMicronesiaMiddle AfricaMoldovaMoroccoNepalNetherlandsNicaraguaNigeriaNorth AmericaNorth MacedoniaNorthern AfricaNorthern EuropeNorwayOceaniaPakistanPanamaPeruPhilippinesPolandPortugalRomaniaRussiaSaudi ArabiaScotlandSenegalSerbiaSierra LeoneSingaporeSomaliaSouth AfricaSouth AmericaSouth Central AsiaSouth Eastern AsiaSouthern EuropeSpainSri LankaSt. Vincent and the GrenadinesSudanSwedenSwitzerlandSyriaTaiwanThailandTrinidad and TobagoTurkeyUgandaUkraineUruguayUzbekistanVenezuelaVietnamWest IndiesWestern AfricaWestern AsiaWestern EuropeYemenZaireZimbabweAzores
Select to Compare
Race
Ancestry
AfghanAfricanAlaska NativeAlaskan AthabascanAlbanianAleutAlsatianAmericanApacheArabArapahoArgentineanArmenianAssyrian/Chaldean/SyriacAustralianAustrianBahamianBangladeshiBarbadianBasqueBelgianBelizeanBermudanBhutaneseBlackfeetBolivianBrazilianBritishBritish West IndianBulgarianBurmeseCajunCambodianCanadianCape VerdeanCarpatho RusynCelticCentral AmericanCentral American IndianCherokeeCheyenneChickasawChileanChineseChippewaChoctawColombianColvilleComancheCosta RicanCreeCreekCroatianCrowCubanCypriotCzechCzechoslovakianDanishDelawareDominicanDutchDutch West IndianEastern EuropeanEcuadorianEgyptianEnglishEstonianEthiopianEuropeanFijianFilipinoFinnishFrenchFrench American IndianFrench CanadianGermanGerman RussianGhanaianGreekGuamanian/ChamorroGuatemalanGuyaneseHaitianHmongHonduranHopiHoumaHungarianIcelanderIndian (Asian)IndonesianInupiatIranianIraqiIrishIroquoisIsraeliItalianJamaicanJapaneseJordanianKenyanKiowaKoreanLaotianLatvianLebaneseLiberianLithuanianLumbeeLuxembourgerMacedonianMalaysianMalteseMarshalleseMenomineeMexicanMexican American IndianMongolianMoroccanNative HawaiianNavajoNepaleseNew ZealanderNicaraguanNigerianNorthern EuropeanNorwegianOkinawanOsageOttawaPaiutePakistaniPalestinianPanamanianParaguayanPennsylvania GermanPeruvianPimaPolishPortuguesePotawatomiPuebloPuerto RicanPuget Sound SalishRomanianRussianSalvadoranSamoanScandinavianScotch-IrishScottishSeminoleSenegaleseSerbianShoshoneSierra LeoneanSiouxSlavicSlovakSloveneSomaliSouth AfricanSouth AmericanSouth American IndianSoviet UnionSpaniardSpanishSpanish AmericanSpanish American IndianSri LankanSubsaharan AfricanSudaneseSwedishSwissSyrianTaiwaneseThaiTlingit-HaidaTohono O'OdhamTonganTrinidadian and TobagonianTsimshianTurkishU.S. Virgin IslanderUgandanUkrainianUruguayanUteVenezuelanVietnameseWelshWest IndianYakamaYaquiYugoslavianYumanYup'ikZimbabwean
Immigration
NonimmigrantsImmigrantsAfghanistanAfricaAlbaniaArgentinaArmeniaAsiaAustraliaAustriaBahamasBangladeshBarbadosBelarusBelgiumBelizeBoliviaBosnia and HerzegovinaBrazilBulgariaBurma/MyanmarCabo VerdeCambodiaCameroonCanadaCaribbeanCentral AmericaChileChinaColombiaCongoCosta RicaCroatiaCubaCzechoslovakiaDenmarkDominican RepublicEastern AfricaEastern AsiaEastern EuropeEcuadorEgyptEl SalvadorEnglandEritreaEthiopiaEuropeFijiFranceGermanyGhanaGreeceGrenadaGuatemalaGuyanaHaitiHondurasHong KongHungaryIndiaIndonesiaIranIraqIrelandIsraelItalyJamaicaJapanJordanKazakhstanKenyaKoreaKuwaitLaosLatin AmericaLatviaLebanonLiberiaLithuaniaMalaysiaMexicoMicronesiaMiddle AfricaMoldovaMoroccoNepalNetherlandsNicaraguaNigeriaNorth AmericaNorth MacedoniaNorthern AfricaNorthern EuropeNorwayOceaniaPakistanPanamaPeruPhilippinesPolandPortugalRomaniaRussiaSaudi ArabiaScotlandSenegalSerbiaSierra LeoneSingaporeSomaliaSouth AfricaSouth AmericaSouth Central AsiaSouth Eastern AsiaSouthern EuropeSpainSri LankaSt. Vincent and the GrenadinesSudanSwedenSwitzerlandSyriaTaiwanThailandTrinidad and TobagoTurkeyUgandaUkraineUruguayUzbekistanVenezuelaVietnamWest IndiesWestern AfricaWestern AsiaWestern EuropeYemenZaireZimbabweAzores
Disability Age Under 5
Income
Poverty
Unemployment
Labor Participation
Family Structure
Vehicle Availability
Education Level
Disability

Immigrants from Dominica Disability Age Under 5
Tragic

1.4%
DISABILITY | AGE UNDER 5
0.2/ 100
METRIC RATING
262nd/ 347
METRIC RANK

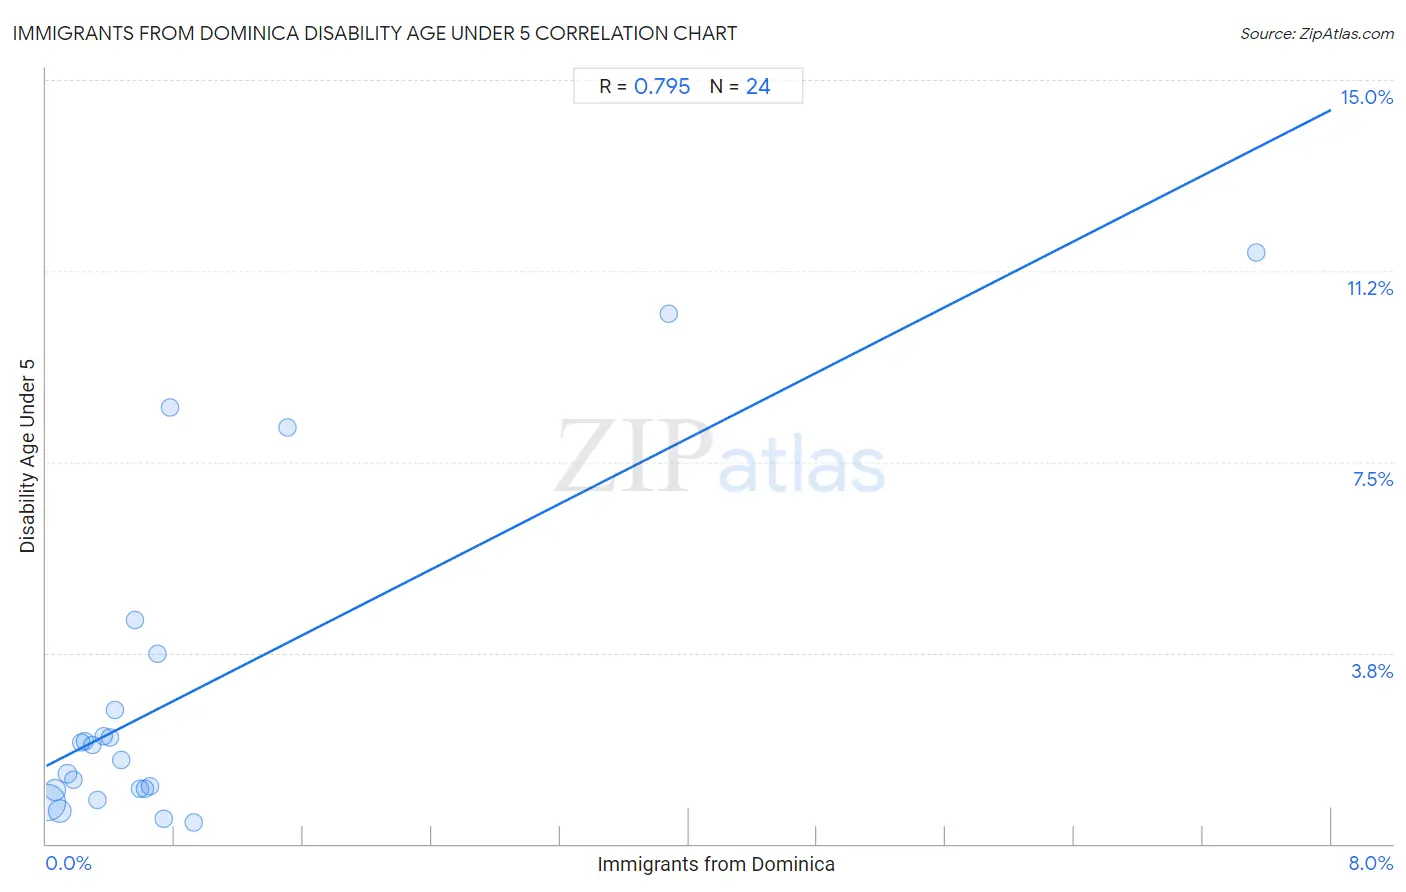
Immigrants from Dominica Disability Age Under 5 Correlation Chart

The statistical analysis conducted on geographies consisting of 63,480,802 people shows a strong positive correlation between the proportion of Immigrants from Dominica and percentage of population with a disability under the age of 5 in the United States with a correlation coefficient (R) of 0.795 and weighted average of 1.4%. On average, for every 1% (one percent) increase in Immigrants from Dominica within a typical geography, there is an increase of 1.6% in percentage of population with a disability under the age of 5.
Immigrants from Dominica Disability Age Under 5
It is essential to understand that the correlation between the percentage of Immigrants from Dominica and percentage of population with a disability under the age of 5 does not imply a direct cause-and-effect relationship. It remains uncertain whether the presence of Immigrants from Dominica influences an upward or downward trend in the level of percentage of population with a disability under the age of 5 within an area, or if Immigrants from Dominica simply ended up residing in those areas with higher or lower levels of percentage of population with a disability under the age of 5 due to other factors.

Demographics Similar to Immigrants from Dominica by Disability Age Under 5

In terms of disability age under 5, the demographic groups most similar to Immigrants from Dominica are Spanish (1.4%, a difference of 0.060%), Immigrants from Netherlands (1.4%, a difference of 0.16%), Yugoslavian (1.4%, a difference of 0.21%), Carpatho Rusyn (1.4%, a difference of 0.25%), and Immigrants from Germany (1.4%, a difference of 0.28%).
DemographicsRating | RankDisability Age Under 5
Immigrants from Liberia
0.6
/100
|
#255
Tragic
1.4%
Immigrants from Western Europe
0.5
/100
|
#256
Tragic
1.4%
Slovenes
0.3
/100
|
#257
Tragic
1.4%
Costa Ricans
0.3
/100
|
#258
Tragic
1.4%
Immigrants from Southern Europe
0.3
/100
|
#259
Tragic
1.4%
Slavs
0.3
/100
|
#260
Tragic
1.4%
Immigrants from Netherlands
0.2
/100
|
#261
Tragic
1.4%
Immigrants from Dominica
0.2
/100
|
#262
Tragic
1.4%
Spanish
0.2
/100
|
#263
Tragic
1.4%
Yugoslavians
0.1
/100
|
#264
Tragic
1.4%
Carpatho Rusyns
0.1
/100
|
#265
Tragic
1.4%
Immigrants from Germany
0.1
/100
|
#266
Tragic
1.4%
Cree
0.1
/100
|
#267
Tragic
1.4%
Belgians
0.1
/100
|
#268
Tragic
1.4%
Austrians
0.1
/100
|
#269
Tragic
1.4%

Immigrants from Dominica Disability Age Under 5 Correlation Summary

MeasurementImmigrants from Dominica DataDisability Age Under 5 Data
Minimum0.0094%0.41%
Maximum7.5%11.6%
Range7.5%11.2%
Mean0.90%3.0%
Median0.45%1.8%
Interquartile 25% (IQ1)0.23%1.1%
Interquartile 75% (IQ3)0.71%3.2%
Interquartile Range (IQR)0.48%2.1%
Standard Deviation (Sample)1.6%3.3%
Standard Deviation (Population)1.6%3.2%

Correlation Details

Immigrants from Dominica PercentileSample SizeDisability Age Under 5
[
0.0%
-
0.5%
]
0.0094%
38,566,9880.82%
[
0.0%
-
0.5%
]
0.055%
7,571,9031.1%
[
0.0%
-
0.5%
]
0.085%
11,017,3000.63%
[
0.0%
-
0.5%
]
0.13%
2,630,3881.4%
[
0.0%
-
0.5%
]
0.17%
1,239,7551.3%
[
0.0%
-
0.5%
]
0.22%
104,8612.0%
[
0.0%
-
0.5%
]
0.24%
245,2812.0%
[
0.0%
-
0.5%
]
0.29%
476,1661.9%
[
0.0%
-
0.5%
]
0.32%
325,7510.85%
[
0.0%
-
0.5%
]
0.36%
246,8822.1%
[
0.0%
-
0.5%
]
0.39%
176,7152.1%
[
0.0%
-
0.5%
]
0.43%
79,8282.6%
[
0.0%
-
0.5%
]
0.47%
155,0891.6%
[
0.5%
-
1.0%
]
0.55%
40,6054.4%
[
0.5%
-
1.0%
]
0.58%
107,7961.1%
[
0.5%
-
1.0%
]
0.61%
243,9461.1%
[
0.5%
-
1.0%
]
0.65%
9,5911.1%
[
0.5%
-
1.0%
]
0.70%
45,1363.7%
[
0.5%
-
1.0%
]
0.73%
44,1230.48%
[
0.5%
-
1.0%
]
0.77%
9,3648.6%
[
0.5%
-
1.0%
]
0.92%
111,1020.41%
[
1.5%
-
2.0%
]
1.50%
19,6138.2%
[
3.5%
-
4.0%
]
3.88%
5,31510.4%
[
7.5%
-
8.0%
]
7.53%
7,30411.6%