Immigrants from Philippines Disability Age Under 5

COMPARE

Immigrants from Philippines
Race
Ancestry
AfghanAfricanAlaska NativeAlaskan AthabascanAlbanianAleutAlsatianAmericanApacheArabArapahoArgentineanArmenianAssyrian/Chaldean/SyriacAustralianAustrianBahamianBangladeshiBarbadianBasqueBelgianBelizeanBermudanBhutaneseBlackfeetBolivianBrazilianBritishBritish West IndianBulgarianBurmeseCajunCambodianCanadianCape VerdeanCarpatho RusynCelticCentral AmericanCentral American IndianCherokeeCheyenneChickasawChileanChineseChippewaChoctawColombianColvilleComancheCosta RicanCreeCreekCroatianCrowCubanCypriotCzechCzechoslovakianDanishDelawareDominicanDutchDutch West IndianEastern EuropeanEcuadorianEgyptianEnglishEstonianEthiopianEuropeanFijianFilipinoFinnishFrenchFrench American IndianFrench CanadianGermanGerman RussianGhanaianGreekGuamanian/ChamorroGuatemalanGuyaneseHaitianHmongHonduranHopiHoumaHungarianIcelanderIndian (Asian)IndonesianInupiatIranianIraqiIrishIroquoisIsraeliItalianJamaicanJapaneseJordanianKenyanKiowaKoreanLaotianLatvianLebaneseLiberianLithuanianLumbeeLuxembourgerMacedonianMalaysianMalteseMarshalleseMenomineeMexicanMexican American IndianMongolianMoroccanNative HawaiianNavajoNepaleseNew ZealanderNicaraguanNigerianNorthern EuropeanNorwegianOkinawanOsageOttawaPaiutePakistaniPalestinianPanamanianParaguayanPennsylvania GermanPeruvianPimaPolishPortuguesePotawatomiPuebloPuerto RicanPuget Sound SalishRomanianRussianSalvadoranSamoanScandinavianScotch-IrishScottishSeminoleSenegaleseSerbianShoshoneSierra LeoneanSiouxSlavicSlovakSloveneSomaliSouth AfricanSouth AmericanSouth American IndianSoviet UnionSpaniardSpanishSpanish AmericanSpanish American IndianSri LankanSubsaharan AfricanSudaneseSwedishSwissSyrianTaiwaneseThaiTlingit-HaidaTohono O'OdhamTonganTrinidadian and TobagonianTsimshianTurkishU.S. Virgin IslanderUgandanUkrainianUruguayanUteVenezuelanVietnameseWelshWest IndianYakamaYaquiYugoslavianYumanYup'ikZimbabwean
Immigration
NonimmigrantsImmigrantsAfghanistanAfricaAlbaniaArgentinaArmeniaAsiaAustraliaAustriaBahamasBangladeshBarbadosBelarusBelgiumBelizeBoliviaBosnia and HerzegovinaBrazilBulgariaBurma/MyanmarCabo VerdeCambodiaCameroonCanadaCaribbeanCentral AmericaChileChinaColombiaCongoCosta RicaCroatiaCubaCzechoslovakiaDenmarkDominicaDominican RepublicEastern AfricaEastern AsiaEastern EuropeEcuadorEgyptEl SalvadorEnglandEritreaEthiopiaEuropeFijiFranceGermanyGhanaGreeceGrenadaGuatemalaGuyanaHaitiHondurasHong KongHungaryIndiaIndonesiaIranIraqIrelandIsraelItalyJamaicaJapanJordanKazakhstanKenyaKoreaKuwaitLaosLatin AmericaLatviaLebanonLiberiaLithuaniaMalaysiaMexicoMicronesiaMiddle AfricaMoldovaMoroccoNepalNetherlandsNicaraguaNigeriaNorth AmericaNorth MacedoniaNorthern AfricaNorthern EuropeNorwayOceaniaPakistanPanamaPeruPhilippinesPolandPortugalRomaniaRussiaSaudi ArabiaScotlandSenegalSerbiaSierra LeoneSingaporeSomaliaSouth AfricaSouth AmericaSouth Central AsiaSouth Eastern AsiaSouthern EuropeSpainSri LankaSt. Vincent and the GrenadinesSudanSwedenSwitzerlandSyriaTaiwanThailandTrinidad and TobagoTurkeyUgandaUkraineUruguayUzbekistanVenezuelaVietnamWest IndiesWestern AfricaWestern AsiaWestern EuropeYemenZaireZimbabweAzores
Select to Compare
Race
Ancestry
AfghanAfricanAlaska NativeAlaskan AthabascanAlbanianAleutAlsatianAmericanApacheArabArapahoArgentineanArmenianAssyrian/Chaldean/SyriacAustralianAustrianBahamianBangladeshiBarbadianBasqueBelgianBelizeanBermudanBhutaneseBlackfeetBolivianBrazilianBritishBritish West IndianBulgarianBurmeseCajunCambodianCanadianCape VerdeanCarpatho RusynCelticCentral AmericanCentral American IndianCherokeeCheyenneChickasawChileanChineseChippewaChoctawColombianColvilleComancheCosta RicanCreeCreekCroatianCrowCubanCypriotCzechCzechoslovakianDanishDelawareDominicanDutchDutch West IndianEastern EuropeanEcuadorianEgyptianEnglishEstonianEthiopianEuropeanFijianFilipinoFinnishFrenchFrench American IndianFrench CanadianGermanGerman RussianGhanaianGreekGuamanian/ChamorroGuatemalanGuyaneseHaitianHmongHonduranHopiHoumaHungarianIcelanderIndian (Asian)IndonesianInupiatIranianIraqiIrishIroquoisIsraeliItalianJamaicanJapaneseJordanianKenyanKiowaKoreanLaotianLatvianLebaneseLiberianLithuanianLumbeeLuxembourgerMacedonianMalaysianMalteseMarshalleseMenomineeMexicanMexican American IndianMongolianMoroccanNative HawaiianNavajoNepaleseNew ZealanderNicaraguanNigerianNorthern EuropeanNorwegianOkinawanOsageOttawaPaiutePakistaniPalestinianPanamanianParaguayanPennsylvania GermanPeruvianPimaPolishPortuguesePotawatomiPuebloPuerto RicanPuget Sound SalishRomanianRussianSalvadoranSamoanScandinavianScotch-IrishScottishSeminoleSenegaleseSerbianShoshoneSierra LeoneanSiouxSlavicSlovakSloveneSomaliSouth AfricanSouth AmericanSouth American IndianSoviet UnionSpaniardSpanishSpanish AmericanSpanish American IndianSri LankanSubsaharan AfricanSudaneseSwedishSwissSyrianTaiwaneseThaiTlingit-HaidaTohono O'OdhamTonganTrinidadian and TobagonianTsimshianTurkishU.S. Virgin IslanderUgandanUkrainianUruguayanUteVenezuelanVietnameseWelshWest IndianYakamaYaquiYugoslavianYumanYup'ikZimbabwean
Immigration
NonimmigrantsImmigrantsAfghanistanAfricaAlbaniaArgentinaArmeniaAsiaAustraliaAustriaBahamasBangladeshBarbadosBelarusBelgiumBelizeBoliviaBosnia and HerzegovinaBrazilBulgariaBurma/MyanmarCabo VerdeCambodiaCameroonCanadaCaribbeanCentral AmericaChileChinaColombiaCongoCosta RicaCroatiaCubaCzechoslovakiaDenmarkDominicaDominican RepublicEastern AfricaEastern AsiaEastern EuropeEcuadorEgyptEl SalvadorEnglandEritreaEthiopiaEuropeFijiFranceGermanyGhanaGreeceGrenadaGuatemalaGuyanaHaitiHondurasHong KongHungaryIndiaIndonesiaIranIraqIrelandIsraelItalyJamaicaJapanJordanKazakhstanKenyaKoreaKuwaitLaosLatin AmericaLatviaLebanonLiberiaLithuaniaMalaysiaMexicoMicronesiaMiddle AfricaMoldovaMoroccoNepalNetherlandsNicaraguaNigeriaNorth AmericaNorth MacedoniaNorthern AfricaNorthern EuropeNorwayOceaniaPakistanPanamaPeruPolandPortugalRomaniaRussiaSaudi ArabiaScotlandSenegalSerbiaSierra LeoneSingaporeSomaliaSouth AfricaSouth AmericaSouth Central AsiaSouth Eastern AsiaSouthern EuropeSpainSri LankaSt. Vincent and the GrenadinesSudanSwedenSwitzerlandSyriaTaiwanThailandTrinidad and TobagoTurkeyUgandaUkraineUruguayUzbekistanVenezuelaVietnamWest IndiesWestern AfricaWestern AsiaWestern EuropeYemenZaireZimbabweAzores
Disability Age Under 5
Income
Poverty
Unemployment
Labor Participation
Family Structure
Vehicle Availability
Education Level
Disability

Immigrants from Philippines Disability Age Under 5
Exceptional

1.2%
DISABILITY | AGE UNDER 5
93.5/ 100
METRIC RATING
117th/ 347
METRIC RANK

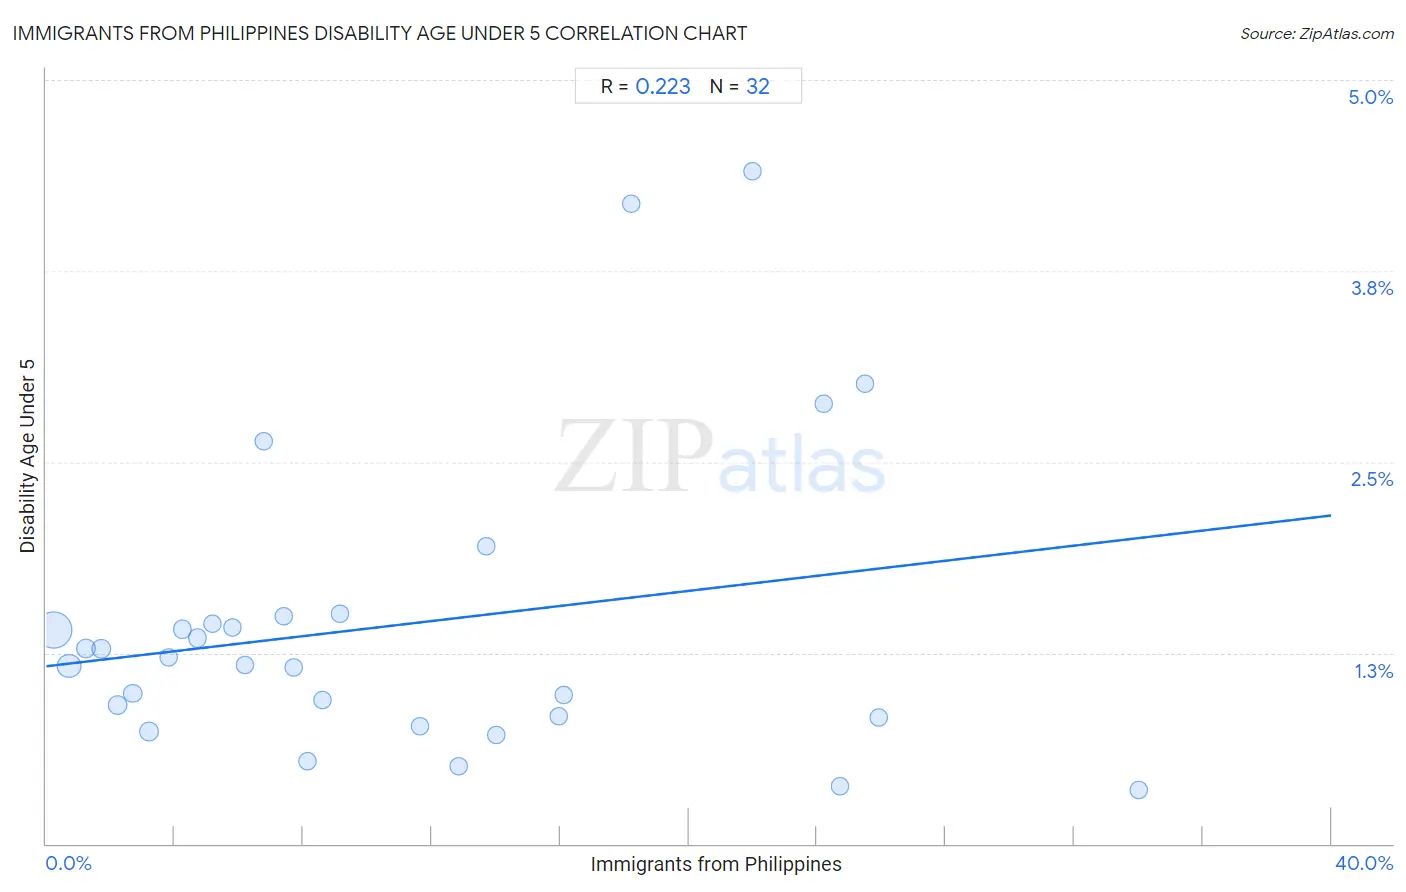
Immigrants from Philippines Disability Age Under 5 Correlation Chart

The statistical analysis conducted on geographies consisting of 241,635,312 people shows a weak positive correlation between the proportion of Immigrants from Philippines and percentage of population with a disability under the age of 5 in the United States with a correlation coefficient (R) of 0.223 and weighted average of 1.2%. On average, for every 1% (one percent) increase in Immigrants from Philippines within a typical geography, there is an increase of 0.025% in percentage of population with a disability under the age of 5.
Immigrants from Philippines Disability Age Under 5
It is essential to understand that the correlation between the percentage of Immigrants from Philippines and percentage of population with a disability under the age of 5 does not imply a direct cause-and-effect relationship. It remains uncertain whether the presence of Immigrants from Philippines influences an upward or downward trend in the level of percentage of population with a disability under the age of 5 within an area, or if Immigrants from Philippines simply ended up residing in those areas with higher or lower levels of percentage of population with a disability under the age of 5 due to other factors.

Demographics Similar to Immigrants from Philippines by Disability Age Under 5

In terms of disability age under 5, the demographic groups most similar to Immigrants from Philippines are Immigrants from Venezuela (1.2%, a difference of 0.030%), Immigrants from Northern Africa (1.2%, a difference of 0.13%), Immigrants from Caribbean (1.2%, a difference of 0.15%), Belizean (1.2%, a difference of 0.17%), and Immigrants from Oceania (1.2%, a difference of 0.31%).
DemographicsRating | RankDisability Age Under 5
Immigrants from Lebanon
95.0
/100
|
#110
Exceptional
1.2%
Senegalese
94.6
/100
|
#111
Exceptional
1.2%
Immigrants from Australia
94.4
/100
|
#112
Exceptional
1.2%
Immigrants from Oceania
94.2
/100
|
#113
Exceptional
1.2%
Belizeans
93.9
/100
|
#114
Exceptional
1.2%
Immigrants from Caribbean
93.8
/100
|
#115
Exceptional
1.2%
Immigrants from Northern Africa
93.8
/100
|
#116
Exceptional
1.2%
Immigrants from Philippines
93.5
/100
|
#117
Exceptional
1.2%
Immigrants from Venezuela
93.4
/100
|
#118
Exceptional
1.2%
Bhutanese
92.5
/100
|
#119
Exceptional
1.2%
Immigrants from Eritrea
92.3
/100
|
#120
Exceptional
1.2%
Immigrants from Senegal
91.4
/100
|
#121
Exceptional
1.2%
Aleuts
90.7
/100
|
#122
Exceptional
1.2%
Zimbabweans
90.6
/100
|
#123
Exceptional
1.2%
Immigrants from Cambodia
90.5
/100
|
#124
Exceptional
1.2%

Immigrants from Philippines Disability Age Under 5 Correlation Summary

MeasurementImmigrants from Philippines DataDisability Age Under 5 Data
Minimum0.22%0.35%
Maximum34.0%4.4%
Range33.8%4.0%
Mean10.9%1.4%
Median7.9%1.2%
Interquartile 25% (IQ1)4.0%0.83%
Interquartile 75% (IQ3)16.0%1.5%
Interquartile Range (IQR)12.0%0.64%
Standard Deviation (Sample)8.9%0.99%
Standard Deviation (Population)8.8%0.97%

Correlation Details

Immigrants from Philippines PercentileSample SizeDisability Age Under 5
[
0.0%
-
0.5%
]
0.22%
145,647,7541.4%
[
0.5%
-
1.0%
]
0.70%
43,163,0201.2%
[
1.0%
-
1.5%
]
1.24%
14,304,3841.3%
[
1.5%
-
2.0%
]
1.71%
8,850,8051.3%
[
2.0%
-
2.5%
]
2.24%
8,792,3470.91%
[
2.5%
-
3.0%
]
2.70%
5,848,6970.98%
[
3.0%
-
3.5%
]
3.20%
5,796,3130.73%
[
3.5%
-
4.0%
]
3.80%
1,744,6191.2%
[
4.0%
-
4.5%
]
4.24%
1,787,3321.4%
[
4.5%
-
5.0%
]
4.71%
1,358,2841.3%
[
5.0%
-
5.5%
]
5.19%
348,8061.4%
[
5.5%
-
6.0%
]
5.80%
660,2881.4%
[
6.0%
-
6.5%
]
6.18%
551,8361.2%
[
6.5%
-
7.0%
]
6.77%
337,5892.6%
[
7.0%
-
7.5%
]
7.39%
147,3321.5%
[
7.5%
-
8.0%
]
7.72%
758,2301.2%
[
8.0%
-
8.5%
]
8.15%
600,8790.54%
[
8.5%
-
9.0%
]
8.58%
81,4520.94%
[
9.0%
-
9.5%
]
9.15%
43,7021.5%
[
11.5%
-
12.0%
]
11.63%
239,3210.77%
[
12.5%
-
13.0%
]
12.82%
78,1110.51%
[
13.5%
-
14.0%
]
13.71%
92,7261.9%
[
14.0%
-
14.5%
]
14.02%
29,9590.71%
[
15.5%
-
16.0%
]
15.93%
17,6040.83%
[
16.0%
-
16.5%
]
16.11%
117,4340.98%
[
18.0%
-
18.5%
]
18.22%
4,6284.2%
[
21.5%
-
22.0%
]
21.99%
13,9194.4%
[
24.0%
-
24.5%
]
24.18%
27,2332.9%
[
24.5%
-
25.0%
]
24.71%
52,3280.37%
[
25.0%
-
25.5%
]
25.49%
25,9023.0%
[
25.5%
-
26.0%
]
25.90%
72,6050.83%
[
33.5%
-
34.0%
]
33.99%
39,8730.35%