Senegalese Disability Age Under 5

COMPARE

Senegalese
Race
Ancestry
AfghanAfricanAlaska NativeAlaskan AthabascanAlbanianAleutAlsatianAmericanApacheArabArapahoArgentineanArmenianAssyrian/Chaldean/SyriacAustralianAustrianBahamianBangladeshiBarbadianBasqueBelgianBelizeanBermudanBhutaneseBlackfeetBolivianBrazilianBritishBritish West IndianBulgarianBurmeseCajunCambodianCanadianCape VerdeanCarpatho RusynCelticCentral AmericanCentral American IndianCherokeeCheyenneChickasawChileanChineseChippewaChoctawColombianColvilleComancheCosta RicanCreeCreekCroatianCrowCubanCypriotCzechCzechoslovakianDanishDelawareDominicanDutchDutch West IndianEastern EuropeanEcuadorianEgyptianEnglishEstonianEthiopianEuropeanFijianFilipinoFinnishFrenchFrench American IndianFrench CanadianGermanGerman RussianGhanaianGreekGuamanian/ChamorroGuatemalanGuyaneseHaitianHmongHonduranHopiHoumaHungarianIcelanderIndian (Asian)IndonesianInupiatIranianIraqiIrishIroquoisIsraeliItalianJamaicanJapaneseJordanianKenyanKiowaKoreanLaotianLatvianLebaneseLiberianLithuanianLumbeeLuxembourgerMacedonianMalaysianMalteseMarshalleseMenomineeMexicanMexican American IndianMongolianMoroccanNative HawaiianNavajoNepaleseNew ZealanderNicaraguanNigerianNorthern EuropeanNorwegianOkinawanOsageOttawaPaiutePakistaniPalestinianPanamanianParaguayanPennsylvania GermanPeruvianPimaPolishPortuguesePotawatomiPuebloPuerto RicanPuget Sound SalishRomanianRussianSalvadoranSamoanScandinavianScotch-IrishScottishSeminoleSenegaleseSerbianShoshoneSierra LeoneanSiouxSlavicSlovakSloveneSomaliSouth AfricanSouth AmericanSouth American IndianSoviet UnionSpaniardSpanishSpanish AmericanSpanish American IndianSri LankanSubsaharan AfricanSudaneseSwedishSwissSyrianTaiwaneseThaiTlingit-HaidaTohono O'OdhamTonganTrinidadian and TobagonianTsimshianTurkishU.S. Virgin IslanderUgandanUkrainianUruguayanUteVenezuelanVietnameseWelshWest IndianYakamaYaquiYugoslavianYumanYup'ikZimbabwean
Immigration
NonimmigrantsImmigrantsAfghanistanAfricaAlbaniaArgentinaArmeniaAsiaAustraliaAustriaBahamasBangladeshBarbadosBelarusBelgiumBelizeBoliviaBosnia and HerzegovinaBrazilBulgariaBurma/MyanmarCabo VerdeCambodiaCameroonCanadaCaribbeanCentral AmericaChileChinaColombiaCongoCosta RicaCroatiaCubaCzechoslovakiaDenmarkDominicaDominican RepublicEastern AfricaEastern AsiaEastern EuropeEcuadorEgyptEl SalvadorEnglandEritreaEthiopiaEuropeFijiFranceGermanyGhanaGreeceGrenadaGuatemalaGuyanaHaitiHondurasHong KongHungaryIndiaIndonesiaIranIraqIrelandIsraelItalyJamaicaJapanJordanKazakhstanKenyaKoreaKuwaitLaosLatin AmericaLatviaLebanonLiberiaLithuaniaMalaysiaMexicoMicronesiaMiddle AfricaMoldovaMoroccoNepalNetherlandsNicaraguaNigeriaNorth AmericaNorth MacedoniaNorthern AfricaNorthern EuropeNorwayOceaniaPakistanPanamaPeruPhilippinesPolandPortugalRomaniaRussiaSaudi ArabiaScotlandSenegalSerbiaSierra LeoneSingaporeSomaliaSouth AfricaSouth AmericaSouth Central AsiaSouth Eastern AsiaSouthern EuropeSpainSri LankaSt. Vincent and the GrenadinesSudanSwedenSwitzerlandSyriaTaiwanThailandTrinidad and TobagoTurkeyUgandaUkraineUruguayUzbekistanVenezuelaVietnamWest IndiesWestern AfricaWestern AsiaWestern EuropeYemenZaireZimbabweAzores
Select to Compare
Race
Ancestry
AfghanAfricanAlaska NativeAlaskan AthabascanAlbanianAleutAlsatianAmericanApacheArabArapahoArgentineanArmenianAssyrian/Chaldean/SyriacAustralianAustrianBahamianBangladeshiBarbadianBasqueBelgianBelizeanBermudanBhutaneseBlackfeetBolivianBrazilianBritishBritish West IndianBulgarianBurmeseCajunCambodianCanadianCape VerdeanCarpatho RusynCelticCentral AmericanCentral American IndianCherokeeCheyenneChickasawChileanChineseChippewaChoctawColombianColvilleComancheCosta RicanCreeCreekCroatianCrowCubanCypriotCzechCzechoslovakianDanishDelawareDominicanDutchDutch West IndianEastern EuropeanEcuadorianEgyptianEnglishEstonianEthiopianEuropeanFijianFilipinoFinnishFrenchFrench American IndianFrench CanadianGermanGerman RussianGhanaianGreekGuamanian/ChamorroGuatemalanGuyaneseHaitianHmongHonduranHopiHoumaHungarianIcelanderIndian (Asian)IndonesianInupiatIranianIraqiIrishIroquoisIsraeliItalianJamaicanJapaneseJordanianKenyanKiowaKoreanLaotianLatvianLebaneseLiberianLithuanianLumbeeLuxembourgerMacedonianMalaysianMalteseMarshalleseMenomineeMexicanMexican American IndianMongolianMoroccanNative HawaiianNavajoNepaleseNew ZealanderNicaraguanNigerianNorthern EuropeanNorwegianOkinawanOsageOttawaPaiutePakistaniPalestinianPanamanianParaguayanPennsylvania GermanPeruvianPimaPolishPortuguesePotawatomiPuebloPuerto RicanPuget Sound SalishRomanianRussianSalvadoranSamoanScandinavianScotch-IrishScottishSeminoleSerbianShoshoneSierra LeoneanSiouxSlavicSlovakSloveneSomaliSouth AfricanSouth AmericanSouth American IndianSoviet UnionSpaniardSpanishSpanish AmericanSpanish American IndianSri LankanSubsaharan AfricanSudaneseSwedishSwissSyrianTaiwaneseThaiTlingit-HaidaTohono O'OdhamTonganTrinidadian and TobagonianTsimshianTurkishU.S. Virgin IslanderUgandanUkrainianUruguayanUteVenezuelanVietnameseWelshWest IndianYakamaYaquiYugoslavianYumanYup'ikZimbabwean
Immigration
NonimmigrantsImmigrantsAfghanistanAfricaAlbaniaArgentinaArmeniaAsiaAustraliaAustriaBahamasBangladeshBarbadosBelarusBelgiumBelizeBoliviaBosnia and HerzegovinaBrazilBulgariaBurma/MyanmarCabo VerdeCambodiaCameroonCanadaCaribbeanCentral AmericaChileChinaColombiaCongoCosta RicaCroatiaCubaCzechoslovakiaDenmarkDominicaDominican RepublicEastern AfricaEastern AsiaEastern EuropeEcuadorEgyptEl SalvadorEnglandEritreaEthiopiaEuropeFijiFranceGermanyGhanaGreeceGrenadaGuatemalaGuyanaHaitiHondurasHong KongHungaryIndiaIndonesiaIranIraqIrelandIsraelItalyJamaicaJapanJordanKazakhstanKenyaKoreaKuwaitLaosLatin AmericaLatviaLebanonLiberiaLithuaniaMalaysiaMexicoMicronesiaMiddle AfricaMoldovaMoroccoNepalNetherlandsNicaraguaNigeriaNorth AmericaNorth MacedoniaNorthern AfricaNorthern EuropeNorwayOceaniaPakistanPanamaPeruPhilippinesPolandPortugalRomaniaRussiaSaudi ArabiaScotlandSenegalSerbiaSierra LeoneSingaporeSomaliaSouth AfricaSouth AmericaSouth Central AsiaSouth Eastern AsiaSouthern EuropeSpainSri LankaSt. Vincent and the GrenadinesSudanSwedenSwitzerlandSyriaTaiwanThailandTrinidad and TobagoTurkeyUgandaUkraineUruguayUzbekistanVenezuelaVietnamWest IndiesWestern AfricaWestern AsiaWestern EuropeYemenZaireZimbabweAzores
Disability Age Under 5
Income
Poverty
Unemployment
Labor Participation
Family Structure
Vehicle Availability
Education Level
Disability

Senegalese Disability Age Under 5
Exceptional

1.2%
DISABILITY | AGE UNDER 5
94.6/ 100
METRIC RATING
111th/ 347
METRIC RANK

Senegalese Disability Age Under 5 Correlation Chart

The statistical analysis conducted on geographies consisting of 62,306,904 people shows a strong positive correlation between the proportion of Senegalese and percentage of population with a disability under the age of 5 in the United States with a correlation coefficient (R) of 0.780 and weighted average of 1.2%. On average, for every 1% (one percent) increase in Senegalese within a typical geography, there is an increase of 2.0% in percentage of population with a disability under the age of 5.
Senegalese Disability Age Under 5
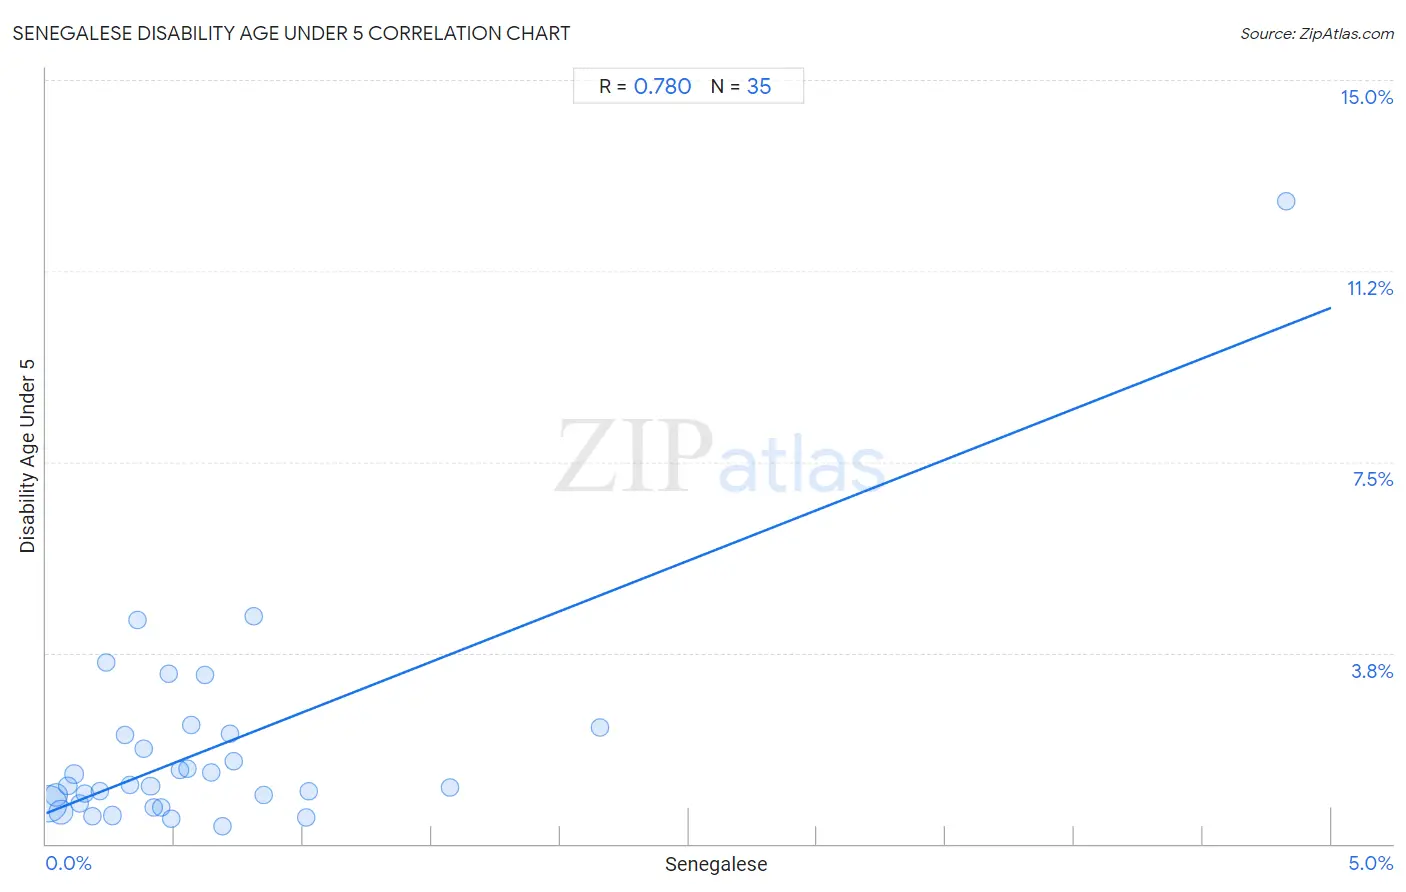
It is essential to understand that the correlation between the percentage of Senegalese and percentage of population with a disability under the age of 5 does not imply a direct cause-and-effect relationship. It remains uncertain whether the presence of Senegalese influences an upward or downward trend in the level of percentage of population with a disability under the age of 5 within an area, or if Senegalese simply ended up residing in those areas with higher or lower levels of percentage of population with a disability under the age of 5 due to other factors.

Demographics Similar to Senegalese by Disability Age Under 5

In terms of disability age under 5, the demographic groups most similar to Senegalese are Immigrants from Australia (1.2%, a difference of 0.11%), Immigrants from Oceania (1.2%, a difference of 0.17%), Immigrants from Lebanon (1.2%, a difference of 0.20%), Immigrants from Panama (1.2%, a difference of 0.22%), and Iraqi (1.2%, a difference of 0.24%).
DemographicsRating | RankDisability Age Under 5
Indonesians
95.9
/100
|
#104
Exceptional
1.2%
Immigrants from South Africa
95.6
/100
|
#105
Exceptional
1.2%
Cambodians
95.4
/100
|
#106
Exceptional
1.2%
Immigrants from West Indies
95.3
/100
|
#107
Exceptional
1.2%
Iraqis
95.1
/100
|
#108
Exceptional
1.2%
Immigrants from Panama
95.0
/100
|
#109
Exceptional
1.2%
Immigrants from Lebanon
95.0
/100
|
#110
Exceptional
1.2%
Senegalese
94.6
/100
|
#111
Exceptional
1.2%
Immigrants from Australia
94.4
/100
|
#112
Exceptional
1.2%
Immigrants from Oceania
94.2
/100
|
#113
Exceptional
1.2%
Belizeans
93.9
/100
|
#114
Exceptional
1.2%
Immigrants from Caribbean
93.8
/100
|
#115
Exceptional
1.2%
Immigrants from Northern Africa
93.8
/100
|
#116
Exceptional
1.2%
Immigrants from Philippines
93.5
/100
|
#117
Exceptional
1.2%
Immigrants from Venezuela
93.4
/100
|
#118
Exceptional
1.2%

Senegalese Disability Age Under 5 Correlation Summary

MeasurementSenegalese DataDisability Age Under 5 Data
Minimum0.0088%0.35%
Maximum4.8%12.6%
Range4.8%12.3%
Mean0.64%1.9%
Median0.45%1.1%
Interquartile 25% (IQ1)0.21%0.77%
Interquartile 75% (IQ3)0.71%2.2%
Interquartile Range (IQR)0.51%1.4%
Standard Deviation (Sample)0.85%2.2%
Standard Deviation (Population)0.84%2.1%

Correlation Details

Senegalese PercentileSample SizeDisability Age Under 5
[
0.0%
-
0.5%
]
0.0088%
33,774,6170.77%
[
0.0%
-
0.5%
]
0.037%
9,230,7140.96%
[
0.0%
-
0.5%
]
0.056%
12,504,3070.63%
[
0.0%
-
0.5%
]
0.085%
1,210,2371.1%
[
0.0%
-
0.5%
]
0.11%
911,0351.4%
[
0.0%
-
0.5%
]
0.13%
1,060,2810.80%
[
0.0%
-
0.5%
]
0.15%
686,0970.98%
[
0.0%
-
0.5%
]
0.18%
153,8070.53%
[
0.0%
-
0.5%
]
0.21%
442,1191.0%
[
0.0%
-
0.5%
]
0.23%
73,4613.6%
[
0.0%
-
0.5%
]
0.26%
363,2920.55%
[
0.0%
-
0.5%
]
0.31%
169,4562.1%
[
0.0%
-
0.5%
]
0.33%
224,5261.2%
[
0.0%
-
0.5%
]
0.36%
11,1994.4%
[
0.0%
-
0.5%
]
0.38%
113,4891.9%
[
0.0%
-
0.5%
]
0.41%
197,0211.1%
[
0.0%
-
0.5%
]
0.42%
127,3500.71%
[
0.0%
-
0.5%
]
0.45%
150,4200.72%
[
0.0%
-
0.5%
]
0.48%
11,1083.3%
[
0.0%
-
0.5%
]
0.49%
48,8230.49%
[
0.5%
-
1.0%
]
0.52%
185,4151.4%
[
0.5%
-
1.0%
]
0.55%
41,0731.5%
[
0.5%
-
1.0%
]
0.56%
23,3982.3%
[
0.5%
-
1.0%
]
0.62%
134,2023.3%
[
0.5%
-
1.0%
]
0.64%
87,6251.4%
[
0.5%
-
1.0%
]
0.69%
69,4400.35%
[
0.5%
-
1.0%
]
0.71%
39,0332.2%
[
0.5%
-
1.0%
]
0.73%
56,5561.6%
[
0.5%
-
1.0%
]
0.81%
50,5744.5%
[
0.5%
-
1.0%
]
0.84%
29,5060.95%
[
1.0%
-
1.5%
]
1.01%
64,3860.51%
[
1.0%
-
1.5%
]
1.02%
32,6701.0%
[
1.5%
-
2.0%
]
1.57%
19,0691.1%
[
2.0%
-
2.5%
]
2.15%
5,7082.3%
[
4.5%
-
5.0%
]
4.83%
4,89012.6%