Immigrants from Jordan Disability Age Under 5
COMPARE
Immigrants from Jordan
Select to Compare
Disability Age Under 5
Immigrants from Jordan Disability Age Under 5
1.1%
DISABILITY | AGE UNDER 5
97.9/ 100
METRIC RATING
82nd/ 347
METRIC RANK
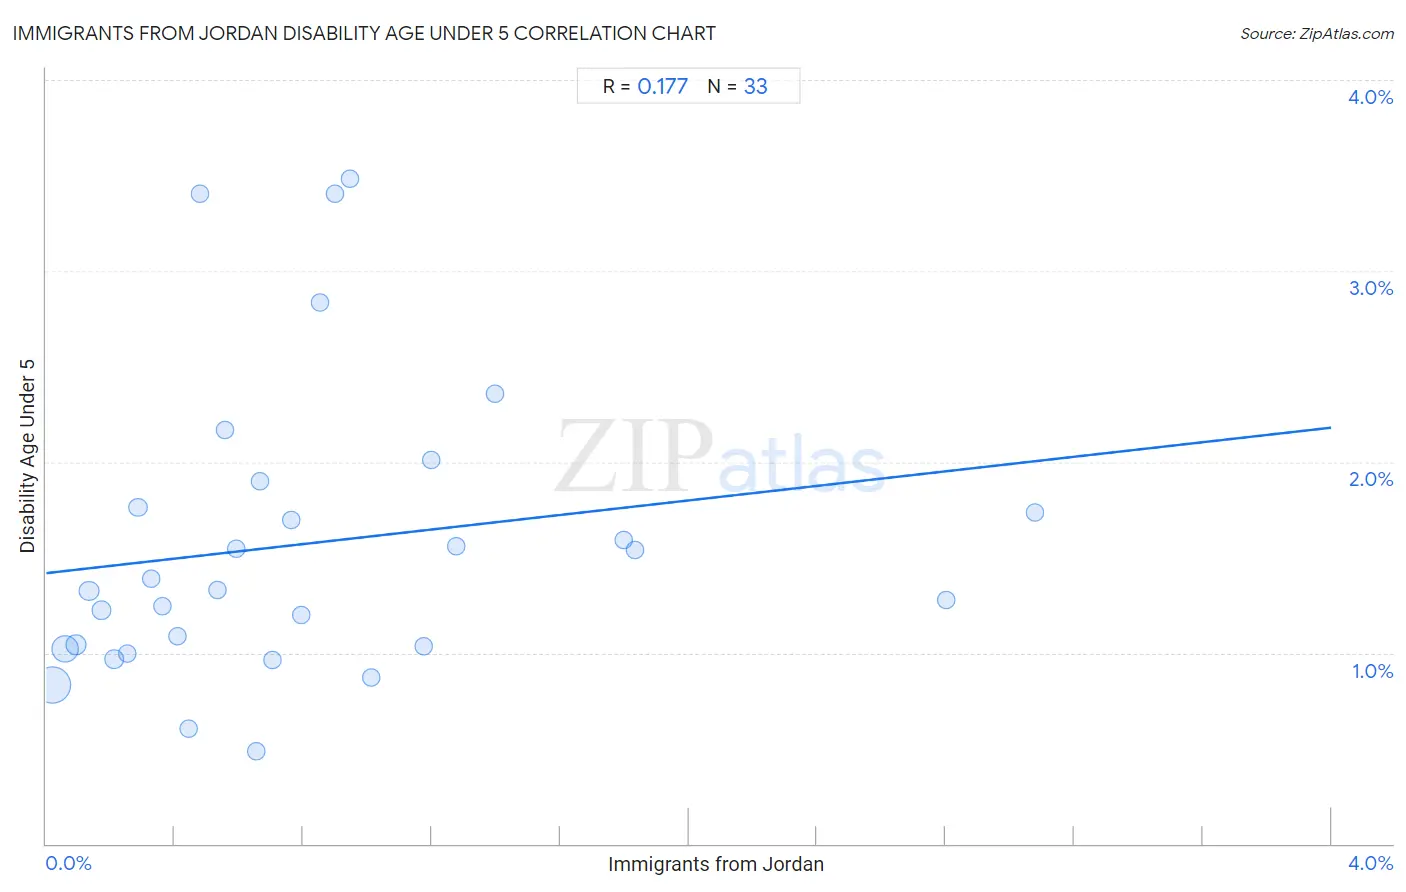
Immigrants from Jordan Disability Age Under 5 Correlation Chart
The statistical analysis conducted on geographies consisting of 123,224,652 people shows a poor positive correlation between the proportion of Immigrants from Jordan and percentage of population with a disability under the age of 5 in the United States with a correlation coefficient (R) of 0.177 and weighted average of 1.1%. On average, for every 1% (one percent) increase in Immigrants from Jordan within a typical geography, there is an increase of 0.19% in percentage of population with a disability under the age of 5.
It is essential to understand that the correlation between the percentage of Immigrants from Jordan and percentage of population with a disability under the age of 5 does not imply a direct cause-and-effect relationship. It remains uncertain whether the presence of Immigrants from Jordan influences an upward or downward trend in the level of percentage of population with a disability under the age of 5 within an area, or if Immigrants from Jordan simply ended up residing in those areas with higher or lower levels of percentage of population with a disability under the age of 5 due to other factors.
Demographics Similar to Immigrants from Jordan by Disability Age Under 5
In terms of disability age under 5, the demographic groups most similar to Immigrants from Jordan are Immigrants from Syria (1.1%, a difference of 0.010%), Turkish (1.1%, a difference of 0.11%), Immigrants from Trinidad and Tobago (1.1%, a difference of 0.13%), Hmong (1.1%, a difference of 0.16%), and Immigrants from Zaire (1.1%, a difference of 0.16%).
| Demographics | Rating | Rank | Disability Age Under 5 |
| Immigrants from Pakistan | 98.4 /100 | #75 | Exceptional 1.1% |
| Immigrants from Burma/Myanmar | 98.2 /100 | #76 | Exceptional 1.1% |
| Immigrants from Denmark | 98.1 /100 | #77 | Exceptional 1.1% |
| West Indians | 98.0 /100 | #78 | Exceptional 1.1% |
| Hmong | 98.0 /100 | #79 | Exceptional 1.1% |
| Immigrants from Trinidad and Tobago | 98.0 /100 | #80 | Exceptional 1.1% |
| Turks | 98.0 /100 | #81 | Exceptional 1.1% |
| Immigrants from Jordan | 97.9 /100 | #82 | Exceptional 1.1% |
| Immigrants from Syria | 97.9 /100 | #83 | Exceptional 1.1% |
| Immigrants from Zaire | 97.8 /100 | #84 | Exceptional 1.1% |
| Sudanese | 97.7 /100 | #85 | Exceptional 1.1% |
| Okinawans | 97.6 /100 | #86 | Exceptional 1.1% |
| Ugandans | 97.5 /100 | #87 | Exceptional 1.1% |
| Immigrants from Dominican Republic | 97.5 /100 | #88 | Exceptional 1.1% |
| Ethiopians | 97.2 /100 | #89 | Exceptional 1.1% |
Immigrants from Jordan Disability Age Under 5 Correlation Summary
| Measurement | Immigrants from Jordan Data | Disability Age Under 5 Data |
| Minimum | 0.021% | 0.48% |
| Maximum | 3.1% | 3.5% |
| Range | 3.1% | 3.0% |
| Mean | 0.81% | 1.6% |
| Median | 0.65% | 1.3% |
| Interquartile 25% (IQ1) | 0.31% | 1.0% |
| Interquartile 75% (IQ3) | 1.1% | 1.8% |
| Interquartile Range (IQR) | 0.79% | 0.80% |
| Standard Deviation (Sample) | 0.72% | 0.78% |
| Standard Deviation (Population) | 0.71% | 0.76% |
Correlation Details
| Immigrants from Jordan Percentile | Sample Size | Disability Age Under 5 |
[ 0.0% - 0.5% ] 0.021% | 66,392,615 | 0.83% |
[ 0.0% - 0.5% ] 0.057% | 30,168,503 | 1.0% |
[ 0.0% - 0.5% ] 0.093% | 10,499,858 | 1.0% |
[ 0.0% - 0.5% ] 0.13% | 6,842,818 | 1.3% |
[ 0.0% - 0.5% ] 0.17% | 2,798,303 | 1.2% |
[ 0.0% - 0.5% ] 0.21% | 1,384,666 | 0.97% |
[ 0.0% - 0.5% ] 0.25% | 1,424,857 | 1.00% |
[ 0.0% - 0.5% ] 0.29% | 784,639 | 1.8% |
[ 0.0% - 0.5% ] 0.33% | 460,522 | 1.4% |
[ 0.0% - 0.5% ] 0.36% | 501,524 | 1.2% |
[ 0.0% - 0.5% ] 0.41% | 277,014 | 1.1% |
[ 0.0% - 0.5% ] 0.44% | 749,022 | 0.60% |
[ 0.0% - 0.5% ] 0.48% | 97,687 | 3.4% |
[ 0.5% - 1.0% ] 0.53% | 86,024 | 1.3% |
[ 0.5% - 1.0% ] 0.56% | 72,333 | 2.2% |
[ 0.5% - 1.0% ] 0.59% | 106,331 | 1.5% |
[ 0.5% - 1.0% ] 0.65% | 32,965 | 0.48% |
[ 0.5% - 1.0% ] 0.67% | 88,402 | 1.9% |
[ 0.5% - 1.0% ] 0.70% | 20,013 | 0.96% |
[ 0.5% - 1.0% ] 0.76% | 72,502 | 1.7% |
[ 0.5% - 1.0% ] 0.79% | 50,066 | 1.2% |
[ 0.5% - 1.0% ] 0.85% | 13,732 | 2.8% |
[ 0.5% - 1.0% ] 0.90% | 42,169 | 3.4% |
[ 0.5% - 1.0% ] 0.95% | 22,318 | 3.5% |
[ 1.0% - 1.5% ] 1.01% | 43,737 | 0.87% |
[ 1.0% - 1.5% ] 1.17% | 4,511 | 1.0% |
[ 1.0% - 1.5% ] 1.20% | 45,084 | 2.0% |
[ 1.0% - 1.5% ] 1.28% | 58,244 | 1.6% |
[ 1.0% - 1.5% ] 1.40% | 8,670 | 2.4% |
[ 1.5% - 2.0% ] 1.80% | 23,173 | 1.6% |
[ 1.5% - 2.0% ] 1.83% | 22,765 | 1.5% |
[ 2.5% - 3.0% ] 2.80% | 9,960 | 1.3% |
[ 3.0% - 3.5% ] 3.08% | 19,625 | 1.7% |