Ukrainian Disability Age Under 5

COMPARE

Ukrainian
Race
Ancestry
AfghanAfricanAlaska NativeAlaskan AthabascanAlbanianAleutAlsatianAmericanApacheArabArapahoArgentineanArmenianAssyrian/Chaldean/SyriacAustralianAustrianBahamianBangladeshiBarbadianBasqueBelgianBelizeanBermudanBhutaneseBlackfeetBolivianBrazilianBritishBritish West IndianBulgarianBurmeseCajunCambodianCanadianCape VerdeanCarpatho RusynCelticCentral AmericanCentral American IndianCherokeeCheyenneChickasawChileanChineseChippewaChoctawColombianColvilleComancheCosta RicanCreeCreekCroatianCrowCubanCypriotCzechCzechoslovakianDanishDelawareDominicanDutchDutch West IndianEastern EuropeanEcuadorianEgyptianEnglishEstonianEthiopianEuropeanFijianFilipinoFinnishFrenchFrench American IndianFrench CanadianGermanGerman RussianGhanaianGreekGuamanian/ChamorroGuatemalanGuyaneseHaitianHmongHonduranHopiHoumaHungarianIcelanderIndian (Asian)IndonesianInupiatIranianIraqiIrishIroquoisIsraeliItalianJamaicanJapaneseJordanianKenyanKiowaKoreanLaotianLatvianLebaneseLiberianLithuanianLumbeeLuxembourgerMacedonianMalaysianMalteseMarshalleseMenomineeMexicanMexican American IndianMongolianMoroccanNative HawaiianNavajoNepaleseNew ZealanderNicaraguanNigerianNorthern EuropeanNorwegianOkinawanOsageOttawaPaiutePakistaniPalestinianPanamanianParaguayanPennsylvania GermanPeruvianPimaPolishPortuguesePotawatomiPuebloPuerto RicanPuget Sound SalishRomanianRussianSalvadoranSamoanScandinavianScotch-IrishScottishSeminoleSenegaleseSerbianShoshoneSierra LeoneanSiouxSlavicSlovakSloveneSomaliSouth AfricanSouth AmericanSouth American IndianSoviet UnionSpaniardSpanishSpanish AmericanSpanish American IndianSri LankanSubsaharan AfricanSudaneseSwedishSwissSyrianTaiwaneseThaiTlingit-HaidaTohono O'OdhamTonganTrinidadian and TobagonianTsimshianTurkishU.S. Virgin IslanderUgandanUkrainianUruguayanUteVenezuelanVietnameseWelshWest IndianYakamaYaquiYugoslavianYumanYup'ikZimbabwean
Immigration
NonimmigrantsImmigrantsAfghanistanAfricaAlbaniaArgentinaArmeniaAsiaAustraliaAustriaBahamasBangladeshBarbadosBelarusBelgiumBelizeBoliviaBosnia and HerzegovinaBrazilBulgariaBurma/MyanmarCabo VerdeCambodiaCameroonCanadaCaribbeanCentral AmericaChileChinaColombiaCongoCosta RicaCroatiaCubaCzechoslovakiaDenmarkDominicaDominican RepublicEastern AfricaEastern AsiaEastern EuropeEcuadorEgyptEl SalvadorEnglandEritreaEthiopiaEuropeFijiFranceGermanyGhanaGreeceGrenadaGuatemalaGuyanaHaitiHondurasHong KongHungaryIndiaIndonesiaIranIraqIrelandIsraelItalyJamaicaJapanJordanKazakhstanKenyaKoreaKuwaitLaosLatin AmericaLatviaLebanonLiberiaLithuaniaMalaysiaMexicoMicronesiaMiddle AfricaMoldovaMoroccoNepalNetherlandsNicaraguaNigeriaNorth AmericaNorth MacedoniaNorthern AfricaNorthern EuropeNorwayOceaniaPakistanPanamaPeruPhilippinesPolandPortugalRomaniaRussiaSaudi ArabiaScotlandSenegalSerbiaSierra LeoneSingaporeSomaliaSouth AfricaSouth AmericaSouth Central AsiaSouth Eastern AsiaSouthern EuropeSpainSri LankaSt. Vincent and the GrenadinesSudanSwedenSwitzerlandSyriaTaiwanThailandTrinidad and TobagoTurkeyUgandaUkraineUruguayUzbekistanVenezuelaVietnamWest IndiesWestern AfricaWestern AsiaWestern EuropeYemenZaireZimbabweAzores
Select to Compare
Race
Ancestry
AfghanAfricanAlaska NativeAlaskan AthabascanAlbanianAleutAlsatianAmericanApacheArabArapahoArgentineanArmenianAssyrian/Chaldean/SyriacAustralianAustrianBahamianBangladeshiBarbadianBasqueBelgianBelizeanBermudanBhutaneseBlackfeetBolivianBrazilianBritishBritish West IndianBulgarianBurmeseCajunCambodianCanadianCape VerdeanCarpatho RusynCelticCentral AmericanCentral American IndianCherokeeCheyenneChickasawChileanChineseChippewaChoctawColombianColvilleComancheCosta RicanCreeCreekCroatianCrowCubanCypriotCzechCzechoslovakianDanishDelawareDominicanDutchDutch West IndianEastern EuropeanEcuadorianEgyptianEnglishEstonianEthiopianEuropeanFijianFilipinoFinnishFrenchFrench American IndianFrench CanadianGermanGerman RussianGhanaianGreekGuamanian/ChamorroGuatemalanGuyaneseHaitianHmongHonduranHopiHoumaHungarianIcelanderIndian (Asian)IndonesianInupiatIranianIraqiIrishIroquoisIsraeliItalianJamaicanJapaneseJordanianKenyanKiowaKoreanLaotianLatvianLebaneseLiberianLithuanianLumbeeLuxembourgerMacedonianMalaysianMalteseMarshalleseMenomineeMexicanMexican American IndianMongolianMoroccanNative HawaiianNavajoNepaleseNew ZealanderNicaraguanNigerianNorthern EuropeanNorwegianOkinawanOsageOttawaPaiutePakistaniPalestinianPanamanianParaguayanPennsylvania GermanPeruvianPimaPolishPortuguesePotawatomiPuebloPuerto RicanPuget Sound SalishRomanianRussianSalvadoranSamoanScandinavianScotch-IrishScottishSeminoleSenegaleseSerbianShoshoneSierra LeoneanSiouxSlavicSlovakSloveneSomaliSouth AfricanSouth AmericanSouth American IndianSoviet UnionSpaniardSpanishSpanish AmericanSpanish American IndianSri LankanSubsaharan AfricanSudaneseSwedishSwissSyrianTaiwaneseThaiTlingit-HaidaTohono O'OdhamTonganTrinidadian and TobagonianTsimshianTurkishU.S. Virgin IslanderUgandanUruguayanUteVenezuelanVietnameseWelshWest IndianYakamaYaquiYugoslavianYumanYup'ikZimbabwean
Immigration
NonimmigrantsImmigrantsAfghanistanAfricaAlbaniaArgentinaArmeniaAsiaAustraliaAustriaBahamasBangladeshBarbadosBelarusBelgiumBelizeBoliviaBosnia and HerzegovinaBrazilBulgariaBurma/MyanmarCabo VerdeCambodiaCameroonCanadaCaribbeanCentral AmericaChileChinaColombiaCongoCosta RicaCroatiaCubaCzechoslovakiaDenmarkDominicaDominican RepublicEastern AfricaEastern AsiaEastern EuropeEcuadorEgyptEl SalvadorEnglandEritreaEthiopiaEuropeFijiFranceGermanyGhanaGreeceGrenadaGuatemalaGuyanaHaitiHondurasHong KongHungaryIndiaIndonesiaIranIraqIrelandIsraelItalyJamaicaJapanJordanKazakhstanKenyaKoreaKuwaitLaosLatin AmericaLatviaLebanonLiberiaLithuaniaMalaysiaMexicoMicronesiaMiddle AfricaMoldovaMoroccoNepalNetherlandsNicaraguaNigeriaNorth AmericaNorth MacedoniaNorthern AfricaNorthern EuropeNorwayOceaniaPakistanPanamaPeruPhilippinesPolandPortugalRomaniaRussiaSaudi ArabiaScotlandSenegalSerbiaSierra LeoneSingaporeSomaliaSouth AfricaSouth AmericaSouth Central AsiaSouth Eastern AsiaSouthern EuropeSpainSri LankaSt. Vincent and the GrenadinesSudanSwedenSwitzerlandSyriaTaiwanThailandTrinidad and TobagoTurkeyUgandaUkraineUruguayUzbekistanVenezuelaVietnamWest IndiesWestern AfricaWestern AsiaWestern EuropeYemenZaireZimbabweAzores
Disability Age Under 5
Income
Poverty
Unemployment
Labor Participation
Family Structure
Vehicle Availability
Education Level
Disability

Ukrainian Disability Age Under 5
Tragic

1.3%
DISABILITY | AGE UNDER 5
8.3/ 100
METRIC RATING
222nd/ 347
METRIC RANK

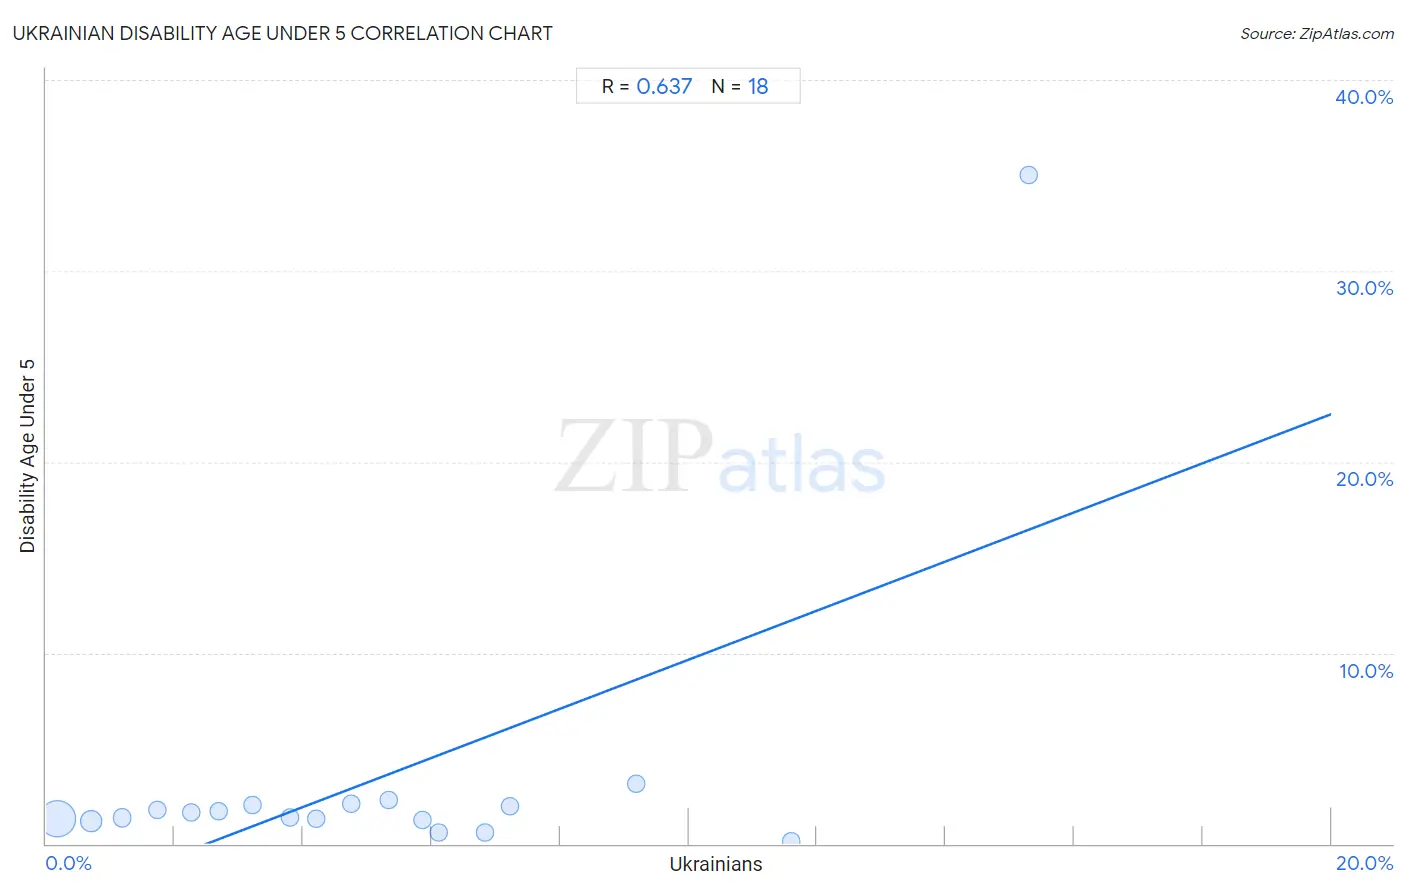
Ukrainian Disability Age Under 5 Correlation Chart

The statistical analysis conducted on geographies consisting of 227,368,617 people shows a significant positive correlation between the proportion of Ukrainians and percentage of population with a disability under the age of 5 in the United States with a correlation coefficient (R) of 0.637 and weighted average of 1.3%. On average, for every 1% (one percent) increase in Ukrainians within a typical geography, there is an increase of 1.3% in percentage of population with a disability under the age of 5.
Ukrainian Disability Age Under 5
It is essential to understand that the correlation between the percentage of Ukrainians and percentage of population with a disability under the age of 5 does not imply a direct cause-and-effect relationship. It remains uncertain whether the presence of Ukrainians influences an upward or downward trend in the level of percentage of population with a disability under the age of 5 within an area, or if Ukrainians simply ended up residing in those areas with higher or lower levels of percentage of population with a disability under the age of 5 due to other factors.

Demographics Similar to Ukrainians by Disability Age Under 5

In terms of disability age under 5, the demographic groups most similar to Ukrainians are Subsaharan African (1.3%, a difference of 0.0%), Hispanic or Latino (1.3%, a difference of 0.19%), Serbian (1.3%, a difference of 0.34%), Latvian (1.3%, a difference of 0.35%), and Panamanian (1.3%, a difference of 0.37%).
DemographicsRating | RankDisability Age Under 5
Syrians
16.1
/100
|
#215
Poor
1.3%
Bangladeshis
15.5
/100
|
#216
Poor
1.3%
Cypriots
14.9
/100
|
#217
Poor
1.3%
Malaysians
13.2
/100
|
#218
Poor
1.3%
Immigrants from Croatia
11.2
/100
|
#219
Poor
1.3%
Serbians
9.6
/100
|
#220
Tragic
1.3%
Sub-Saharan Africans
8.3
/100
|
#221
Tragic
1.3%
Ukrainians
8.3
/100
|
#222
Tragic
1.3%
Hispanics or Latinos
7.7
/100
|
#223
Tragic
1.3%
Latvians
7.1
/100
|
#224
Tragic
1.3%
Panamanians
7.1
/100
|
#225
Tragic
1.3%
Bahamians
7.1
/100
|
#226
Tragic
1.3%
Taiwanese
6.1
/100
|
#227
Tragic
1.3%
Luxembourgers
6.1
/100
|
#228
Tragic
1.3%
Immigrants from Costa Rica
5.5
/100
|
#229
Tragic
1.3%

Ukrainian Disability Age Under 5 Correlation Summary

MeasurementUkrainian DataDisability Age Under 5 Data
Minimum0.18%0.14%
Maximum15.3%35.0%
Range15.1%34.9%
Mean5.1%3.4%
Median4.5%1.5%
Interquartile 25% (IQ1)2.3%1.2%
Interquartile 75% (IQ3)6.8%2.0%
Interquartile Range (IQR)4.6%0.82%
Standard Deviation (Sample)3.9%7.9%
Standard Deviation (Population)3.8%7.7%

Correlation Details

Ukrainian PercentileSample SizeDisability Age Under 5
[
0.0%
-
0.5%
]
0.18%
178,866,6771.3%
[
0.5%
-
1.0%
]
0.70%
37,384,7131.2%
[
1.0%
-
1.5%
]
1.18%
6,270,7321.4%
[
1.5%
-
2.0%
]
1.73%
2,125,5801.7%
[
2.0%
-
2.5%
]
2.26%
849,4541.6%
[
2.5%
-
3.0%
]
2.68%
944,1631.7%
[
3.0%
-
3.5%
]
3.21%
221,4092.0%
[
3.5%
-
4.0%
]
3.80%
214,7951.4%
[
4.0%
-
4.5%
]
4.20%
111,5051.3%
[
4.5%
-
5.0%
]
4.75%
73,7562.1%
[
5.0%
-
5.5%
]
5.33%
6,5292.3%
[
5.5%
-
6.0%
]
5.87%
68,2461.2%
[
6.0%
-
6.5%
]
6.11%
43,0700.57%
[
6.5%
-
7.0%
]
6.82%
83,0970.57%
[
7.0%
-
7.5%
]
7.22%
14,9601.9%
[
9.0%
-
9.5%
]
9.19%
6,6073.1%
[
11.5%
-
12.0%
]
11.60%
83,0690.14%
[
15.0%
-
15.5%
]
15.29%
25535.0%