U.S. Virgin Islander Disability Age Under 5

COMPARE

U.S. Virgin Islander
Race
Ancestry
AfghanAfricanAlaska NativeAlaskan AthabascanAlbanianAleutAlsatianAmericanApacheArabArapahoArgentineanArmenianAssyrian/Chaldean/SyriacAustralianAustrianBahamianBangladeshiBarbadianBasqueBelgianBelizeanBermudanBhutaneseBlackfeetBolivianBrazilianBritishBritish West IndianBulgarianBurmeseCajunCambodianCanadianCape VerdeanCarpatho RusynCelticCentral AmericanCentral American IndianCherokeeCheyenneChickasawChileanChineseChippewaChoctawColombianColvilleComancheCosta RicanCreeCreekCroatianCrowCubanCypriotCzechCzechoslovakianDanishDelawareDominicanDutchDutch West IndianEastern EuropeanEcuadorianEgyptianEnglishEstonianEthiopianEuropeanFijianFilipinoFinnishFrenchFrench American IndianFrench CanadianGermanGerman RussianGhanaianGreekGuamanian/ChamorroGuatemalanGuyaneseHaitianHmongHonduranHopiHoumaHungarianIcelanderIndian (Asian)IndonesianInupiatIranianIraqiIrishIroquoisIsraeliItalianJamaicanJapaneseJordanianKenyanKiowaKoreanLaotianLatvianLebaneseLiberianLithuanianLumbeeLuxembourgerMacedonianMalaysianMalteseMarshalleseMenomineeMexicanMexican American IndianMongolianMoroccanNative HawaiianNavajoNepaleseNew ZealanderNicaraguanNigerianNorthern EuropeanNorwegianOkinawanOsageOttawaPaiutePakistaniPalestinianPanamanianParaguayanPennsylvania GermanPeruvianPimaPolishPortuguesePotawatomiPuebloPuerto RicanPuget Sound SalishRomanianRussianSalvadoranSamoanScandinavianScotch-IrishScottishSeminoleSenegaleseSerbianShoshoneSierra LeoneanSiouxSlavicSlovakSloveneSomaliSouth AfricanSouth AmericanSouth American IndianSoviet UnionSpaniardSpanishSpanish AmericanSpanish American IndianSri LankanSubsaharan AfricanSudaneseSwedishSwissSyrianTaiwaneseThaiTlingit-HaidaTohono O'OdhamTonganTrinidadian and TobagonianTsimshianTurkishU.S. Virgin IslanderUgandanUkrainianUruguayanUteVenezuelanVietnameseWelshWest IndianYakamaYaquiYugoslavianYumanYup'ikZimbabwean
Immigration
NonimmigrantsImmigrantsAfghanistanAfricaAlbaniaArgentinaArmeniaAsiaAustraliaAustriaBahamasBangladeshBarbadosBelarusBelgiumBelizeBoliviaBosnia and HerzegovinaBrazilBulgariaBurma/MyanmarCabo VerdeCambodiaCameroonCanadaCaribbeanCentral AmericaChileChinaColombiaCongoCosta RicaCroatiaCubaCzechoslovakiaDenmarkDominicaDominican RepublicEastern AfricaEastern AsiaEastern EuropeEcuadorEgyptEl SalvadorEnglandEritreaEthiopiaEuropeFijiFranceGermanyGhanaGreeceGrenadaGuatemalaGuyanaHaitiHondurasHong KongHungaryIndiaIndonesiaIranIraqIrelandIsraelItalyJamaicaJapanJordanKazakhstanKenyaKoreaKuwaitLaosLatin AmericaLatviaLebanonLiberiaLithuaniaMalaysiaMexicoMicronesiaMiddle AfricaMoldovaMoroccoNepalNetherlandsNicaraguaNigeriaNorth AmericaNorth MacedoniaNorthern AfricaNorthern EuropeNorwayOceaniaPakistanPanamaPeruPhilippinesPolandPortugalRomaniaRussiaSaudi ArabiaScotlandSenegalSerbiaSierra LeoneSingaporeSomaliaSouth AfricaSouth AmericaSouth Central AsiaSouth Eastern AsiaSouthern EuropeSpainSri LankaSt. Vincent and the GrenadinesSudanSwedenSwitzerlandSyriaTaiwanThailandTrinidad and TobagoTurkeyUgandaUkraineUruguayUzbekistanVenezuelaVietnamWest IndiesWestern AfricaWestern AsiaWestern EuropeYemenZaireZimbabweAzores
Select to Compare
Race
Ancestry
AfghanAfricanAlaska NativeAlaskan AthabascanAlbanianAleutAlsatianAmericanApacheArabArapahoArgentineanArmenianAssyrian/Chaldean/SyriacAustralianAustrianBahamianBangladeshiBarbadianBasqueBelgianBelizeanBermudanBhutaneseBlackfeetBolivianBrazilianBritishBritish West IndianBulgarianBurmeseCajunCambodianCanadianCape VerdeanCarpatho RusynCelticCentral AmericanCentral American IndianCherokeeCheyenneChickasawChileanChineseChippewaChoctawColombianColvilleComancheCosta RicanCreeCreekCroatianCrowCubanCypriotCzechCzechoslovakianDanishDelawareDominicanDutchDutch West IndianEastern EuropeanEcuadorianEgyptianEnglishEstonianEthiopianEuropeanFijianFilipinoFinnishFrenchFrench American IndianFrench CanadianGermanGerman RussianGhanaianGreekGuamanian/ChamorroGuatemalanGuyaneseHaitianHmongHonduranHopiHoumaHungarianIcelanderIndian (Asian)IndonesianInupiatIranianIraqiIrishIroquoisIsraeliItalianJamaicanJapaneseJordanianKenyanKiowaKoreanLaotianLatvianLebaneseLiberianLithuanianLumbeeLuxembourgerMacedonianMalaysianMalteseMarshalleseMenomineeMexicanMexican American IndianMongolianMoroccanNative HawaiianNavajoNepaleseNew ZealanderNicaraguanNigerianNorthern EuropeanNorwegianOkinawanOsageOttawaPaiutePakistaniPalestinianPanamanianParaguayanPennsylvania GermanPeruvianPimaPolishPortuguesePotawatomiPuebloPuerto RicanPuget Sound SalishRomanianRussianSalvadoranSamoanScandinavianScotch-IrishScottishSeminoleSenegaleseSerbianShoshoneSierra LeoneanSiouxSlavicSlovakSloveneSomaliSouth AfricanSouth AmericanSouth American IndianSoviet UnionSpaniardSpanishSpanish AmericanSpanish American IndianSri LankanSubsaharan AfricanSudaneseSwedishSwissSyrianTaiwaneseThaiTlingit-HaidaTohono O'OdhamTonganTrinidadian and TobagonianTsimshianTurkishUgandanUkrainianUruguayanUteVenezuelanVietnameseWelshWest IndianYakamaYaquiYugoslavianYumanYup'ikZimbabwean
Immigration
NonimmigrantsImmigrantsAfghanistanAfricaAlbaniaArgentinaArmeniaAsiaAustraliaAustriaBahamasBangladeshBarbadosBelarusBelgiumBelizeBoliviaBosnia and HerzegovinaBrazilBulgariaBurma/MyanmarCabo VerdeCambodiaCameroonCanadaCaribbeanCentral AmericaChileChinaColombiaCongoCosta RicaCroatiaCubaCzechoslovakiaDenmarkDominicaDominican RepublicEastern AfricaEastern AsiaEastern EuropeEcuadorEgyptEl SalvadorEnglandEritreaEthiopiaEuropeFijiFranceGermanyGhanaGreeceGrenadaGuatemalaGuyanaHaitiHondurasHong KongHungaryIndiaIndonesiaIranIraqIrelandIsraelItalyJamaicaJapanJordanKazakhstanKenyaKoreaKuwaitLaosLatin AmericaLatviaLebanonLiberiaLithuaniaMalaysiaMexicoMicronesiaMiddle AfricaMoldovaMoroccoNepalNetherlandsNicaraguaNigeriaNorth AmericaNorth MacedoniaNorthern AfricaNorthern EuropeNorwayOceaniaPakistanPanamaPeruPhilippinesPolandPortugalRomaniaRussiaSaudi ArabiaScotlandSenegalSerbiaSierra LeoneSingaporeSomaliaSouth AfricaSouth AmericaSouth Central AsiaSouth Eastern AsiaSouthern EuropeSpainSri LankaSt. Vincent and the GrenadinesSudanSwedenSwitzerlandSyriaTaiwanThailandTrinidad and TobagoTurkeyUgandaUkraineUruguayUzbekistanVenezuelaVietnamWest IndiesWestern AfricaWestern AsiaWestern EuropeYemenZaireZimbabweAzores
Disability Age Under 5
Income
Poverty
Unemployment
Labor Participation
Family Structure
Vehicle Availability
Education Level
Disability

U.S. Virgin Islander Disability Age Under 5
Fair

1.3%
DISABILITY | AGE UNDER 5
34.4/ 100
METRIC RATING
195th/ 347
METRIC RANK

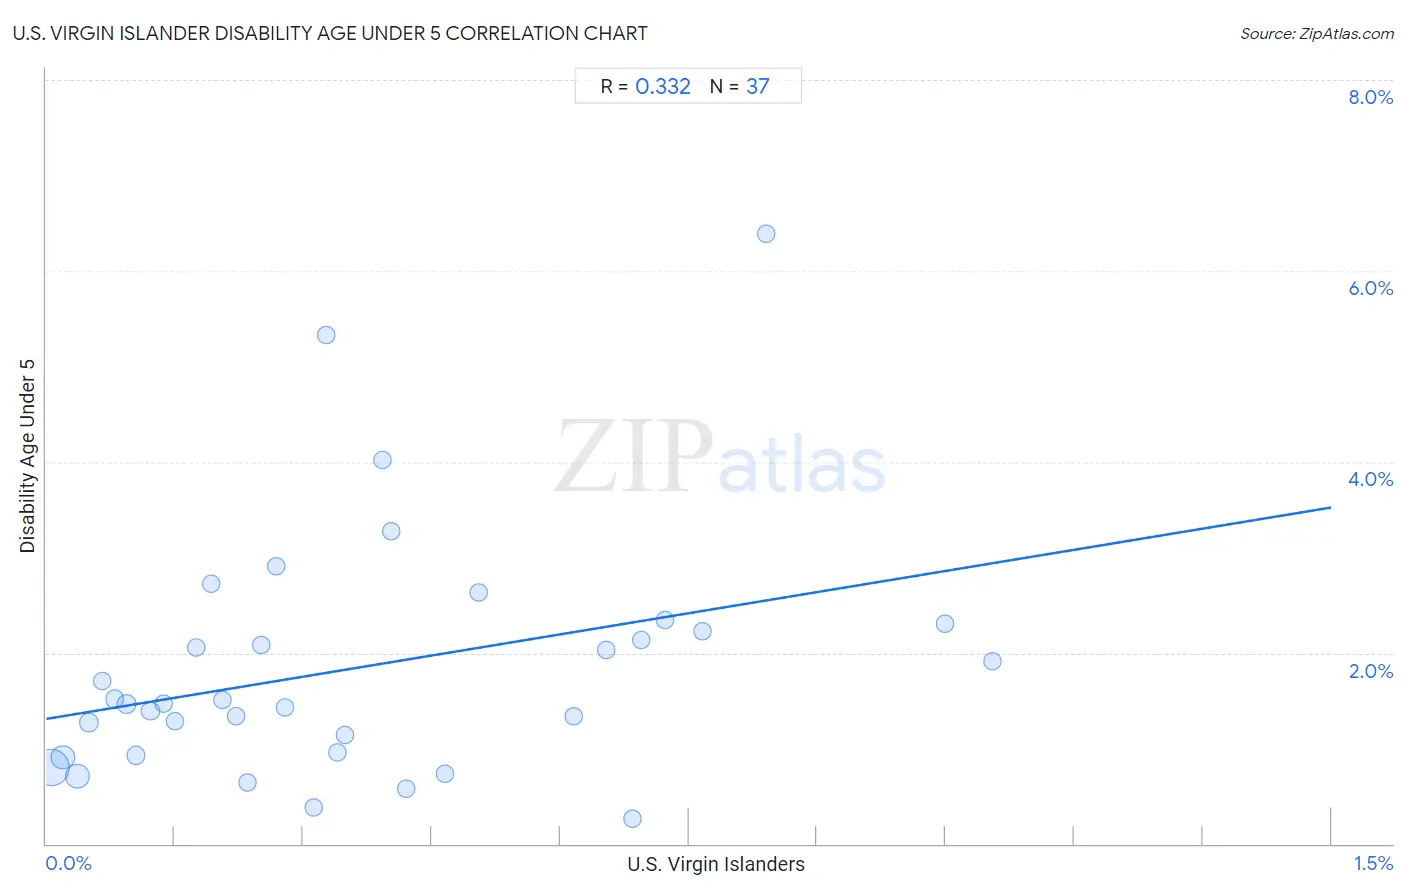
U.S. Virgin Islander Disability Age Under 5 Correlation Chart

The statistical analysis conducted on geographies consisting of 67,886,708 people shows a mild positive correlation between the proportion of U.S. Virgin Islanders and percentage of population with a disability under the age of 5 in the United States with a correlation coefficient (R) of 0.332 and weighted average of 1.3%. On average, for every 1% (one percent) increase in U.S. Virgin Islanders within a typical geography, there is an increase of 1.5% in percentage of population with a disability under the age of 5.
U.S. Virgin Islander Disability Age Under 5
It is essential to understand that the correlation between the percentage of U.S. Virgin Islanders and percentage of population with a disability under the age of 5 does not imply a direct cause-and-effect relationship. It remains uncertain whether the presence of U.S. Virgin Islanders influences an upward or downward trend in the level of percentage of population with a disability under the age of 5 within an area, or if U.S. Virgin Islanders simply ended up residing in those areas with higher or lower levels of percentage of population with a disability under the age of 5 due to other factors.

Demographics Similar to U.S. Virgin Islanders by Disability Age Under 5

In terms of disability age under 5, the demographic groups most similar to U.S. Virgin Islanders are Immigrants from North Macedonia (1.3%, a difference of 0.020%), Immigrants from Sierra Leone (1.3%, a difference of 0.20%), Mexican American Indian (1.3%, a difference of 0.21%), Immigrants from Bosnia and Herzegovina (1.3%, a difference of 0.21%), and Immigrants from Laos (1.3%, a difference of 0.22%).
DemographicsRating | RankDisability Age Under 5
Haitians
39.9
/100
|
#188
Fair
1.3%
Peruvians
37.6
/100
|
#189
Fair
1.3%
Immigrants from Laos
36.6
/100
|
#190
Fair
1.3%
Mexican American Indians
36.6
/100
|
#191
Fair
1.3%
Immigrants from Bosnia and Herzegovina
36.5
/100
|
#192
Fair
1.3%
Immigrants from Sierra Leone
36.5
/100
|
#193
Fair
1.3%
Immigrants from North Macedonia
34.7
/100
|
#194
Fair
1.3%
U.S. Virgin Islanders
34.4
/100
|
#195
Fair
1.3%
Immigrants from Belgium
31.4
/100
|
#196
Fair
1.3%
Immigrants from Somalia
31.3
/100
|
#197
Fair
1.3%
Immigrants from Norway
31.1
/100
|
#198
Fair
1.3%
Jamaicans
30.7
/100
|
#199
Fair
1.3%
Immigrants from Lithuania
27.2
/100
|
#200
Fair
1.3%
Immigrants from Italy
25.4
/100
|
#201
Fair
1.3%
Arapaho
24.1
/100
|
#202
Fair
1.3%

U.S. Virgin Islander Disability Age Under 5 Correlation Summary

MeasurementU.S. Virgin Islander DataDisability Age Under 5 Data
Minimum0.0057%0.26%
Maximum1.1%6.4%
Range1.1%6.1%
Mean0.36%1.8%
Median0.28%1.5%
Interquartile 25% (IQ1)0.13%0.94%
Interquartile 75% (IQ3)0.56%2.3%
Interquartile Range (IQR)0.43%1.3%
Standard Deviation (Sample)0.29%1.3%
Standard Deviation (Population)0.29%1.3%

Correlation Details

U.S. Virgin Islander PercentileSample SizeDisability Age Under 5
[
0.0%
-
0.5%
]
0.0057%
35,297,8800.79%
[
0.0%
-
0.5%
]
0.019%
10,303,6920.90%
[
0.0%
-
0.5%
]
0.036%
12,046,5960.71%
[
0.0%
-
0.5%
]
0.050%
1,949,8081.3%
[
0.0%
-
0.5%
]
0.066%
1,047,1271.7%
[
0.0%
-
0.5%
]
0.080%
1,188,5621.5%
[
0.0%
-
0.5%
]
0.094%
1,234,6961.5%
[
0.0%
-
0.5%
]
0.10%
1,089,9810.93%
[
0.0%
-
0.5%
]
0.12%
538,0441.4%
[
0.0%
-
0.5%
]
0.14%
532,7211.5%
[
0.0%
-
0.5%
]
0.15%
260,3851.3%
[
0.0%
-
0.5%
]
0.18%
81,0952.1%
[
0.0%
-
0.5%
]
0.19%
102,1032.7%
[
0.0%
-
0.5%
]
0.21%
222,7961.5%
[
0.0%
-
0.5%
]
0.22%
286,5631.3%
[
0.0%
-
0.5%
]
0.24%
174,8050.65%
[
0.0%
-
0.5%
]
0.25%
199,3532.1%
[
0.0%
-
0.5%
]
0.27%
57,1412.9%
[
0.0%
-
0.5%
]
0.28%
123,5591.4%
[
0.0%
-
0.5%
]
0.31%
25,9150.37%
[
0.0%
-
0.5%
]
0.33%
16,8525.3%
[
0.0%
-
0.5%
]
0.34%
364,6080.95%
[
0.0%
-
0.5%
]
0.35%
55,7181.1%
[
0.0%
-
0.5%
]
0.39%
45,9434.0%
[
0.0%
-
0.5%
]
0.40%
32,2853.3%
[
0.0%
-
0.5%
]
0.42%
145,3300.58%
[
0.0%
-
0.5%
]
0.47%
30,2860.73%
[
0.5%
-
1.0%
]
0.50%
18,0442.6%
[
0.5%
-
1.0%
]
0.62%
42,6841.3%
[
0.5%
-
1.0%
]
0.65%
78,6242.0%
[
0.5%
-
1.0%
]
0.68%
68,4990.26%
[
0.5%
-
1.0%
]
0.69%
57,3272.1%
[
0.5%
-
1.0%
]
0.72%
31,7172.4%
[
0.5%
-
1.0%
]
0.77%
20,9032.2%
[
0.5%
-
1.0%
]
0.84%
14,2856.4%
[
1.0%
-
1.5%
]
1.05%
37,9542.3%
[
1.0%
-
1.5%
]
1.10%
62,8271.9%