Cuban Disability Age Under 5

COMPARE

Cuban
Race
Ancestry
AfghanAfricanAlaska NativeAlaskan AthabascanAlbanianAleutAlsatianAmericanApacheArabArapahoArgentineanArmenianAssyrian/Chaldean/SyriacAustralianAustrianBahamianBangladeshiBarbadianBasqueBelgianBelizeanBermudanBhutaneseBlackfeetBolivianBrazilianBritishBritish West IndianBulgarianBurmeseCajunCambodianCanadianCape VerdeanCarpatho RusynCelticCentral AmericanCentral American IndianCherokeeCheyenneChickasawChileanChineseChippewaChoctawColombianColvilleComancheCosta RicanCreeCreekCroatianCrowCubanCypriotCzechCzechoslovakianDanishDelawareDominicanDutchDutch West IndianEastern EuropeanEcuadorianEgyptianEnglishEstonianEthiopianEuropeanFijianFilipinoFinnishFrenchFrench American IndianFrench CanadianGermanGerman RussianGhanaianGreekGuamanian/ChamorroGuatemalanGuyaneseHaitianHmongHonduranHopiHoumaHungarianIcelanderIndian (Asian)IndonesianInupiatIranianIraqiIrishIroquoisIsraeliItalianJamaicanJapaneseJordanianKenyanKiowaKoreanLaotianLatvianLebaneseLiberianLithuanianLumbeeLuxembourgerMacedonianMalaysianMalteseMarshalleseMenomineeMexicanMexican American IndianMongolianMoroccanNative HawaiianNavajoNepaleseNew ZealanderNicaraguanNigerianNorthern EuropeanNorwegianOkinawanOsageOttawaPaiutePakistaniPalestinianPanamanianParaguayanPennsylvania GermanPeruvianPimaPolishPortuguesePotawatomiPuebloPuerto RicanPuget Sound SalishRomanianRussianSalvadoranSamoanScandinavianScotch-IrishScottishSeminoleSenegaleseSerbianShoshoneSierra LeoneanSiouxSlavicSlovakSloveneSomaliSouth AfricanSouth AmericanSouth American IndianSoviet UnionSpaniardSpanishSpanish AmericanSpanish American IndianSri LankanSubsaharan AfricanSudaneseSwedishSwissSyrianTaiwaneseThaiTlingit-HaidaTohono O'OdhamTonganTrinidadian and TobagonianTsimshianTurkishU.S. Virgin IslanderUgandanUkrainianUruguayanUteVenezuelanVietnameseWelshWest IndianYakamaYaquiYugoslavianYumanYup'ikZimbabwean
Immigration
NonimmigrantsImmigrantsAfghanistanAfricaAlbaniaArgentinaArmeniaAsiaAustraliaAustriaBahamasBangladeshBarbadosBelarusBelgiumBelizeBoliviaBosnia and HerzegovinaBrazilBulgariaBurma/MyanmarCabo VerdeCambodiaCameroonCanadaCaribbeanCentral AmericaChileChinaColombiaCongoCosta RicaCroatiaCubaCzechoslovakiaDenmarkDominicaDominican RepublicEastern AfricaEastern AsiaEastern EuropeEcuadorEgyptEl SalvadorEnglandEritreaEthiopiaEuropeFijiFranceGermanyGhanaGreeceGrenadaGuatemalaGuyanaHaitiHondurasHong KongHungaryIndiaIndonesiaIranIraqIrelandIsraelItalyJamaicaJapanJordanKazakhstanKenyaKoreaKuwaitLaosLatin AmericaLatviaLebanonLiberiaLithuaniaMalaysiaMexicoMicronesiaMiddle AfricaMoldovaMoroccoNepalNetherlandsNicaraguaNigeriaNorth AmericaNorth MacedoniaNorthern AfricaNorthern EuropeNorwayOceaniaPakistanPanamaPeruPhilippinesPolandPortugalRomaniaRussiaSaudi ArabiaScotlandSenegalSerbiaSierra LeoneSingaporeSomaliaSouth AfricaSouth AmericaSouth Central AsiaSouth Eastern AsiaSouthern EuropeSpainSri LankaSt. Vincent and the GrenadinesSudanSwedenSwitzerlandSyriaTaiwanThailandTrinidad and TobagoTurkeyUgandaUkraineUruguayUzbekistanVenezuelaVietnamWest IndiesWestern AfricaWestern AsiaWestern EuropeYemenZaireZimbabweAzores
Select to Compare
Race
Ancestry
AfghanAfricanAlaska NativeAlaskan AthabascanAlbanianAleutAlsatianAmericanApacheArabArapahoArgentineanArmenianAssyrian/Chaldean/SyriacAustralianAustrianBahamianBangladeshiBarbadianBasqueBelgianBelizeanBermudanBhutaneseBlackfeetBolivianBrazilianBritishBritish West IndianBulgarianBurmeseCajunCambodianCanadianCape VerdeanCarpatho RusynCelticCentral AmericanCentral American IndianCherokeeCheyenneChickasawChileanChineseChippewaChoctawColombianColvilleComancheCosta RicanCreeCreekCroatianCrowCypriotCzechCzechoslovakianDanishDelawareDominicanDutchDutch West IndianEastern EuropeanEcuadorianEgyptianEnglishEstonianEthiopianEuropeanFijianFilipinoFinnishFrenchFrench American IndianFrench CanadianGermanGerman RussianGhanaianGreekGuamanian/ChamorroGuatemalanGuyaneseHaitianHmongHonduranHopiHoumaHungarianIcelanderIndian (Asian)IndonesianInupiatIranianIraqiIrishIroquoisIsraeliItalianJamaicanJapaneseJordanianKenyanKiowaKoreanLaotianLatvianLebaneseLiberianLithuanianLumbeeLuxembourgerMacedonianMalaysianMalteseMarshalleseMenomineeMexicanMexican American IndianMongolianMoroccanNative HawaiianNavajoNepaleseNew ZealanderNicaraguanNigerianNorthern EuropeanNorwegianOkinawanOsageOttawaPaiutePakistaniPalestinianPanamanianParaguayanPennsylvania GermanPeruvianPimaPolishPortuguesePotawatomiPuebloPuerto RicanPuget Sound SalishRomanianRussianSalvadoranSamoanScandinavianScotch-IrishScottishSeminoleSenegaleseSerbianShoshoneSierra LeoneanSiouxSlavicSlovakSloveneSomaliSouth AfricanSouth AmericanSouth American IndianSoviet UnionSpaniardSpanishSpanish AmericanSpanish American IndianSri LankanSubsaharan AfricanSudaneseSwedishSwissSyrianTaiwaneseThaiTlingit-HaidaTohono O'OdhamTonganTrinidadian and TobagonianTsimshianTurkishU.S. Virgin IslanderUgandanUkrainianUruguayanUteVenezuelanVietnameseWelshWest IndianYakamaYaquiYugoslavianYumanYup'ikZimbabwean
Immigration
NonimmigrantsImmigrantsAfghanistanAfricaAlbaniaArgentinaArmeniaAsiaAustraliaAustriaBahamasBangladeshBarbadosBelarusBelgiumBelizeBoliviaBosnia and HerzegovinaBrazilBulgariaBurma/MyanmarCabo VerdeCambodiaCameroonCanadaCaribbeanCentral AmericaChileChinaColombiaCongoCosta RicaCroatiaCubaCzechoslovakiaDenmarkDominicaDominican RepublicEastern AfricaEastern AsiaEastern EuropeEcuadorEgyptEl SalvadorEnglandEritreaEthiopiaEuropeFijiFranceGermanyGhanaGreeceGrenadaGuatemalaGuyanaHaitiHondurasHong KongHungaryIndiaIndonesiaIranIraqIrelandIsraelItalyJamaicaJapanJordanKazakhstanKenyaKoreaKuwaitLaosLatin AmericaLatviaLebanonLiberiaLithuaniaMalaysiaMexicoMicronesiaMiddle AfricaMoldovaMoroccoNepalNetherlandsNicaraguaNigeriaNorth AmericaNorth MacedoniaNorthern AfricaNorthern EuropeNorwayOceaniaPakistanPanamaPeruPhilippinesPolandPortugalRomaniaRussiaSaudi ArabiaScotlandSenegalSerbiaSierra LeoneSingaporeSomaliaSouth AfricaSouth AmericaSouth Central AsiaSouth Eastern AsiaSouthern EuropeSpainSri LankaSt. Vincent and the GrenadinesSudanSwedenSwitzerlandSyriaTaiwanThailandTrinidad and TobagoTurkeyUgandaUkraineUruguayUzbekistanVenezuelaVietnamWest IndiesWestern AfricaWestern AsiaWestern EuropeYemenZaireZimbabweAzores
Disability Age Under 5
Income
Poverty
Unemployment
Labor Participation
Family Structure
Vehicle Availability
Education Level
Disability

Cuban Disability Age Under 5
Average

1.2%
DISABILITY | AGE UNDER 5
42.5/ 100
METRIC RATING
186th/ 347
METRIC RANK

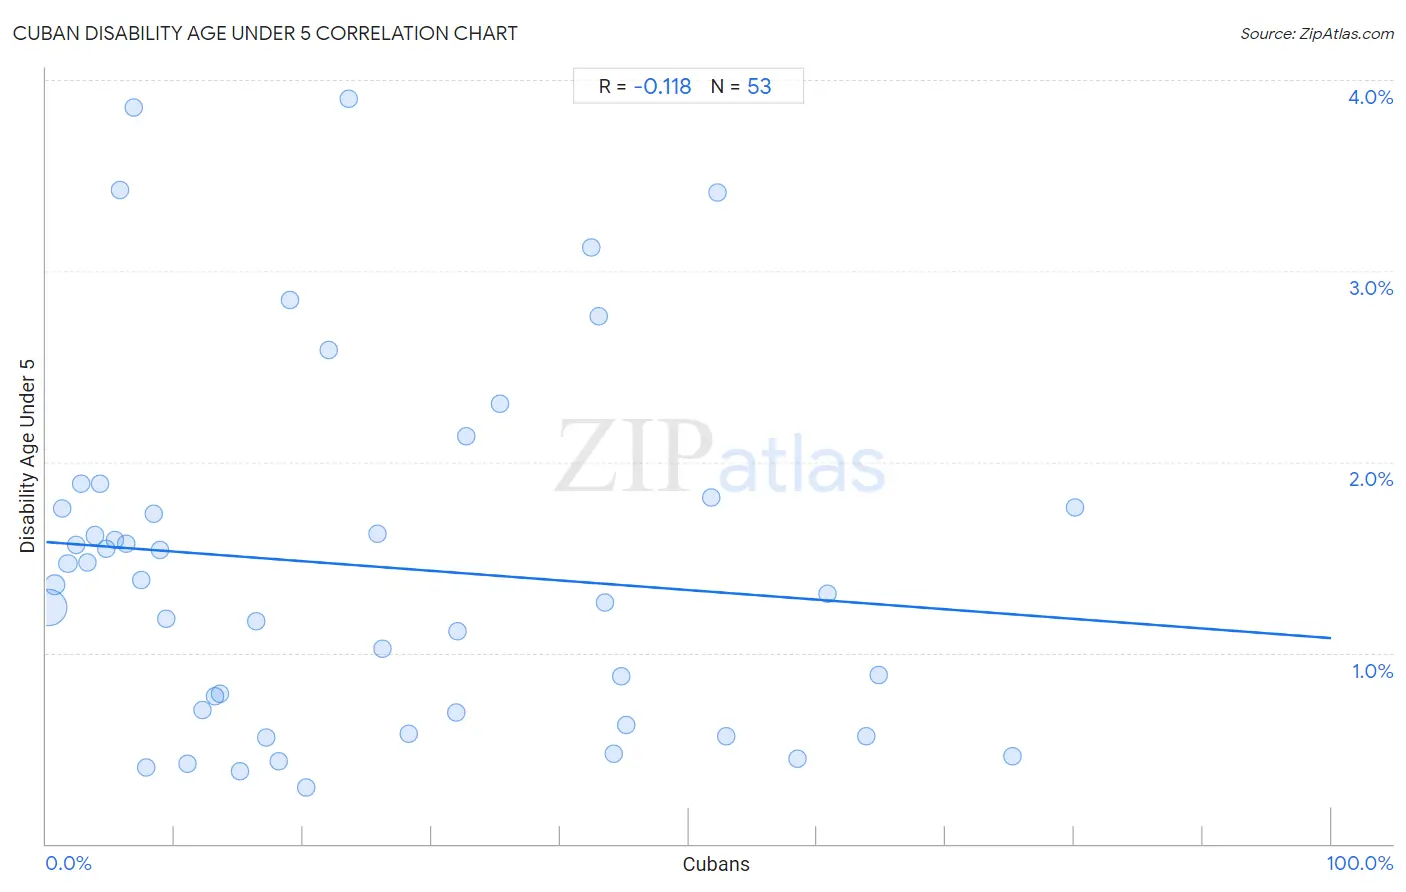
Cuban Disability Age Under 5 Correlation Chart

The statistical analysis conducted on geographies consisting of 234,247,835 people shows a poor negative correlation between the proportion of Cubans and percentage of population with a disability under the age of 5 in the United States with a correlation coefficient (R) of -0.118 and weighted average of 1.2%. On average, for every 1% (one percent) increase in Cubans within a typical geography, there is a decrease of 0.0050% in percentage of population with a disability under the age of 5.
Cuban Disability Age Under 5
It is essential to understand that the correlation between the percentage of Cubans and percentage of population with a disability under the age of 5 does not imply a direct cause-and-effect relationship. It remains uncertain whether the presence of Cubans influences an upward or downward trend in the level of percentage of population with a disability under the age of 5 within an area, or if Cubans simply ended up residing in those areas with higher or lower levels of percentage of population with a disability under the age of 5 due to other factors.

Demographics Similar to Cubans by Disability Age Under 5

In terms of disability age under 5, the demographic groups most similar to Cubans are Immigrants from Western Africa (1.2%, a difference of 0.0%), Palestinian (1.2%, a difference of 0.050%), Immigrants from Saudi Arabia (1.2%, a difference of 0.080%), Macedonian (1.2%, a difference of 0.12%), and Immigrants from Peru (1.2%, a difference of 0.12%).
DemographicsRating | RankDisability Age Under 5
Immigrants from Bahamas
45.2
/100
|
#179
Average
1.2%
Immigrants from Mexico
44.4
/100
|
#180
Average
1.2%
Macedonians
43.7
/100
|
#181
Average
1.2%
Immigrants from Peru
43.7
/100
|
#181
Average
1.2%
Immigrants from Saudi Arabia
43.3
/100
|
#183
Average
1.2%
Palestinians
43.0
/100
|
#184
Average
1.2%
Immigrants from Western Africa
42.5
/100
|
#185
Average
1.2%
Cubans
42.5
/100
|
#186
Average
1.2%
Immigrants from Haiti
40.2
/100
|
#187
Average
1.3%
Haitians
39.9
/100
|
#188
Fair
1.3%
Peruvians
37.6
/100
|
#189
Fair
1.3%
Immigrants from Laos
36.6
/100
|
#190
Fair
1.3%
Mexican American Indians
36.6
/100
|
#191
Fair
1.3%
Immigrants from Bosnia and Herzegovina
36.5
/100
|
#192
Fair
1.3%
Immigrants from Sierra Leone
36.5
/100
|
#193
Fair
1.3%

Cuban Disability Age Under 5 Correlation Summary

MeasurementCuban DataDisability Age Under 5 Data
Minimum0.22%0.29%
Maximum80.1%3.9%
Range79.8%3.6%
Mean25.0%1.5%
Median18.1%1.4%
Interquartile 25% (IQ1)6.5%0.66%
Interquartile 75% (IQ3)43.2%1.8%
Interquartile Range (IQR)36.7%1.1%
Standard Deviation (Sample)21.7%0.93%
Standard Deviation (Population)21.5%0.92%

Correlation Details

Cuban PercentileSample SizeDisability Age Under 5
[
0.0%
-
0.5%
]
0.22%
184,419,9661.2%
[
0.5%
-
1.0%
]
0.68%
28,939,3381.4%
[
1.0%
-
1.5%
]
1.22%
5,972,7031.8%
[
1.5%
-
2.0%
]
1.68%
4,331,8971.5%
[
2.0%
-
2.5%
]
2.29%
2,082,9141.6%
[
2.5%
-
3.0%
]
2.75%
1,997,3891.9%
[
3.0%
-
3.5%
]
3.22%
1,002,5731.5%
[
3.5%
-
4.0%
]
3.75%
889,4331.6%
[
4.0%
-
4.5%
]
4.21%
276,7221.9%
[
4.5%
-
5.0%
]
4.69%
85,4751.5%
[
5.0%
-
5.5%
]
5.31%
240,2701.6%
[
5.5%
-
6.0%
]
5.75%
229,0753.4%
[
6.0%
-
6.5%
]
6.27%
352,4361.6%
[
6.5%
-
7.0%
]
6.82%
104,5823.9%
[
7.0%
-
7.5%
]
7.43%
142,5351.4%
[
7.5%
-
8.0%
]
7.75%
471,5730.40%
[
8.0%
-
8.5%
]
8.38%
46,8751.7%
[
8.5%
-
9.0%
]
8.90%
199,2991.5%
[
9.0%
-
9.5%
]
9.36%
152,7641.2%
[
10.5%
-
11.0%
]
10.97%
41,6610.42%
[
12.0%
-
12.5%
]
12.21%
89,4860.70%
[
13.0%
-
13.5%
]
13.16%
135,1580.77%
[
13.5%
-
14.0%
]
13.50%
37,2740.78%
[
15.0%
-
15.5%
]
15.11%
160,8190.38%
[
16.0%
-
16.5%
]
16.37%
28,7121.2%
[
17.0%
-
17.5%
]
17.15%
36,4050.56%
[
18.0%
-
18.5%
]
18.08%
111,6180.43%
[
18.5%
-
19.0%
]
18.98%
18,2792.8%
[
20.0%
-
20.5%
]
20.27%
79,9960.29%
[
22.0%
-
22.5%
]
22.03%
59,1212.6%
[
23.5%
-
24.0%
]
23.59%
3,1883.9%
[
25.5%
-
26.0%
]
25.82%
32,5821.6%
[
26.0%
-
26.5%
]
26.21%
31,5901.0%
[
28.0%
-
28.5%
]
28.17%
84,3510.58%
[
31.5%
-
32.0%
]
31.87%
27,0330.69%
[
32.0%
-
32.5%
]
32.04%
443,6651.1%
[
32.5%
-
33.0%
]
32.64%
57,3272.1%
[
35.0%
-
35.5%
]
35.28%
37,9542.3%
[
42.0%
-
42.5%
]
42.37%
37,9583.1%
[
42.5%
-
43.0%
]
42.99%
29,2402.8%
[
43.0%
-
43.5%
]
43.45%
57,0661.3%
[
44.0%
-
44.5%
]
44.15%
56,7910.47%
[
44.5%
-
45.0%
]
44.71%
37,9770.88%
[
45.0%
-
45.5%
]
45.18%
35,7050.62%
[
51.5%
-
52.0%
]
51.73%
34,3351.8%
[
52.0%
-
52.5%
]
52.27%
13,1633.4%
[
52.5%
-
53.0%
]
52.97%
29,5300.56%
[
58.0%
-
58.5%
]
58.48%
43,7020.44%
[
60.5%
-
61.0%
]
60.80%
46,7981.3%
[
63.5%
-
64.0%
]
63.81%
52,8510.56%
[
64.5%
-
65.0%
]
64.80%
24,5970.88%
[
75.0%
-
75.5%
]
75.15%
222,9960.46%
[
80.0%
-
80.5%
]
80.06%
71,0881.8%