Immigrants from Scotland Disability Age Under 5
COMPARE
Immigrants from Scotland
Select to Compare
Disability Age Under 5
Immigrants from Scotland Disability Age Under 5
1.4%
DISABILITY | AGE UNDER 5
0.9/ 100
METRIC RATING
252nd/ 347
METRIC RANK
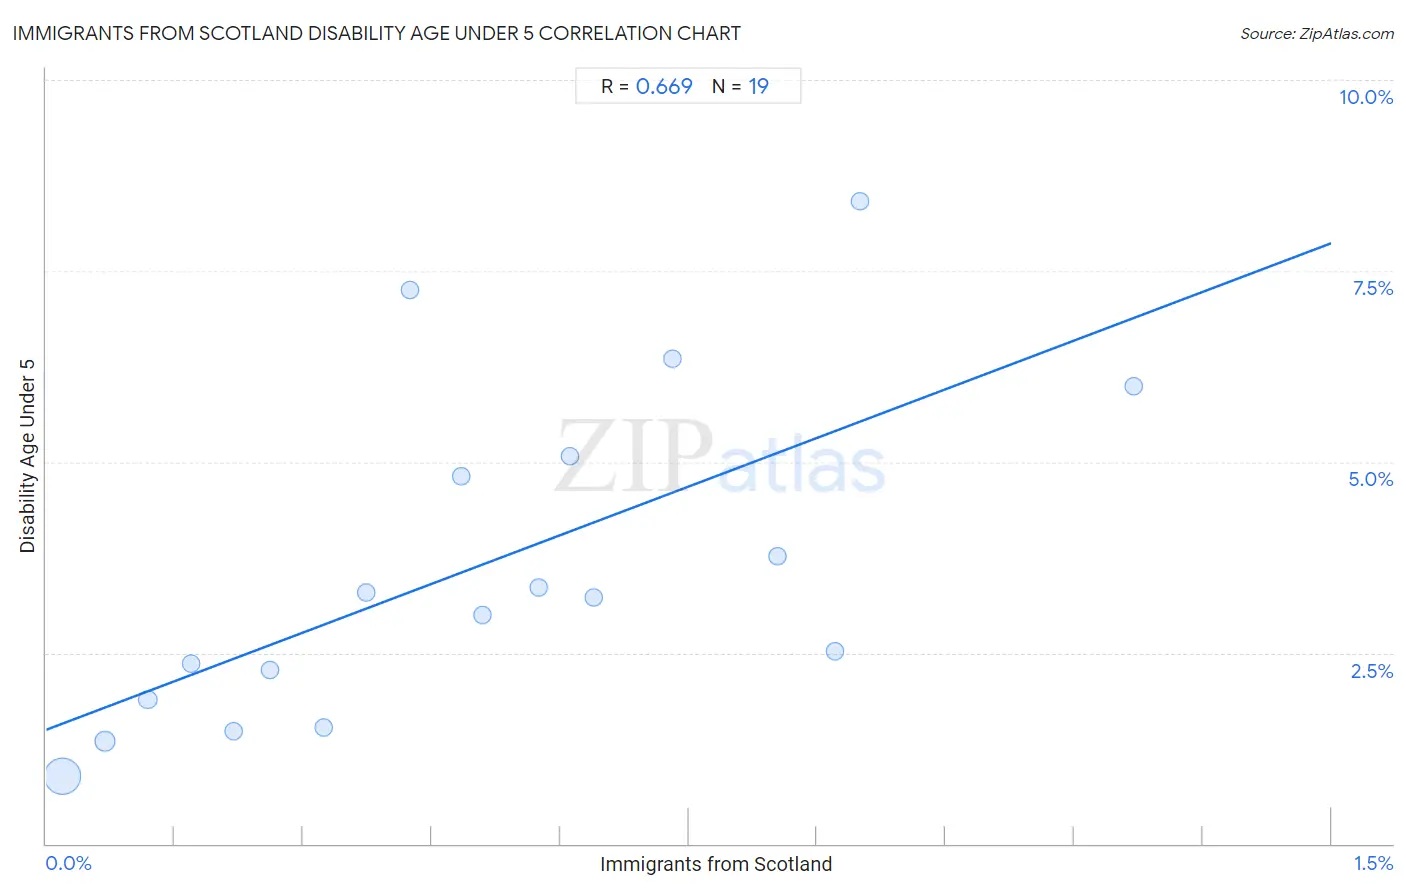
Immigrants from Scotland Disability Age Under 5 Correlation Chart
The statistical analysis conducted on geographies consisting of 125,019,989 people shows a significant positive correlation between the proportion of Immigrants from Scotland and percentage of population with a disability under the age of 5 in the United States with a correlation coefficient (R) of 0.669 and weighted average of 1.4%. On average, for every 1% (one percent) increase in Immigrants from Scotland within a typical geography, there is an increase of 4.2% in percentage of population with a disability under the age of 5.
It is essential to understand that the correlation between the percentage of Immigrants from Scotland and percentage of population with a disability under the age of 5 does not imply a direct cause-and-effect relationship. It remains uncertain whether the presence of Immigrants from Scotland influences an upward or downward trend in the level of percentage of population with a disability under the age of 5 within an area, or if Immigrants from Scotland simply ended up residing in those areas with higher or lower levels of percentage of population with a disability under the age of 5 due to other factors.
Demographics Similar to Immigrants from Scotland by Disability Age Under 5
In terms of disability age under 5, the demographic groups most similar to Immigrants from Scotland are Immigrants from Hungary (1.4%, a difference of 0.040%), African (1.4%, a difference of 0.070%), Bermudan (1.4%, a difference of 0.080%), Eastern European (1.4%, a difference of 0.16%), and Immigrants from England (1.4%, a difference of 0.19%).
| Demographics | Rating | Rank | Disability Age Under 5 |
| Potawatomi | 1.1 /100 | #245 | Tragic 1.4% |
| Russians | 1.0 /100 | #246 | Tragic 1.4% |
| Immigrants from England | 1.0 /100 | #247 | Tragic 1.4% |
| Eastern Europeans | 1.0 /100 | #248 | Tragic 1.4% |
| Bermudans | 1.0 /100 | #249 | Tragic 1.4% |
| Africans | 1.0 /100 | #250 | Tragic 1.4% |
| Immigrants from Hungary | 1.0 /100 | #251 | Tragic 1.4% |
| Immigrants from Scotland | 0.9 /100 | #252 | Tragic 1.4% |
| Australians | 0.7 /100 | #253 | Tragic 1.4% |
| Immigrants from Brazil | 0.7 /100 | #254 | Tragic 1.4% |
| Immigrants from Liberia | 0.6 /100 | #255 | Tragic 1.4% |
| Immigrants from Western Europe | 0.5 /100 | #256 | Tragic 1.4% |
| Slovenes | 0.3 /100 | #257 | Tragic 1.4% |
| Costa Ricans | 0.3 /100 | #258 | Tragic 1.4% |
| Immigrants from Southern Europe | 0.3 /100 | #259 | Tragic 1.4% |
Immigrants from Scotland Disability Age Under 5 Correlation Summary
| Measurement | Immigrants from Scotland Data | Disability Age Under 5 Data |
| Minimum | 0.018% | 0.88% |
| Maximum | 1.3% | 8.4% |
| Range | 1.3% | 7.5% |
| Mean | 0.50% | 3.6% |
| Median | 0.48% | 3.2% |
| Interquartile 25% (IQ1) | 0.22% | 1.9% |
| Interquartile 75% (IQ3) | 0.73% | 5.1% |
| Interquartile Range (IQR) | 0.51% | 3.2% |
| Standard Deviation (Sample) | 0.34% | 2.1% |
| Standard Deviation (Population) | 0.33% | 2.1% |
Correlation Details
| Immigrants from Scotland Percentile | Sample Size | Disability Age Under 5 |
[ 0.0% - 0.5% ] 0.018% | 103,812,941 | 0.88% |
[ 0.0% - 0.5% ] 0.069% | 14,022,253 | 1.3% |
[ 0.0% - 0.5% ] 0.12% | 4,040,896 | 1.9% |
[ 0.0% - 0.5% ] 0.17% | 1,500,841 | 2.4% |
[ 0.0% - 0.5% ] 0.22% | 845,846 | 1.5% |
[ 0.0% - 0.5% ] 0.26% | 287,719 | 2.3% |
[ 0.0% - 0.5% ] 0.32% | 269,463 | 1.5% |
[ 0.0% - 0.5% ] 0.37% | 81,507 | 3.3% |
[ 0.0% - 0.5% ] 0.42% | 21,179 | 7.2% |
[ 0.0% - 0.5% ] 0.48% | 10,126 | 4.8% |
[ 0.5% - 1.0% ] 0.51% | 66,091 | 3.0% |
[ 0.5% - 1.0% ] 0.57% | 3,307 | 3.4% |
[ 0.5% - 1.0% ] 0.61% | 15,063 | 5.1% |
[ 0.5% - 1.0% ] 0.64% | 4,540 | 3.2% |
[ 0.5% - 1.0% ] 0.73% | 820 | 6.3% |
[ 0.5% - 1.0% ] 0.85% | 18,026 | 3.8% |
[ 0.5% - 1.0% ] 0.92% | 5,974 | 2.5% |
[ 0.5% - 1.0% ] 0.95% | 3,157 | 8.4% |
[ 1.0% - 1.5% ] 1.27% | 10,240 | 6.0% |