Chippewa Disability Age Under 5

COMPARE

Chippewa
Race
Ancestry
AfghanAfricanAlaska NativeAlaskan AthabascanAlbanianAleutAlsatianAmericanApacheArabArapahoArgentineanArmenianAssyrian/Chaldean/SyriacAustralianAustrianBahamianBangladeshiBarbadianBasqueBelgianBelizeanBermudanBhutaneseBlackfeetBolivianBrazilianBritishBritish West IndianBulgarianBurmeseCajunCambodianCanadianCape VerdeanCarpatho RusynCelticCentral AmericanCentral American IndianCherokeeCheyenneChickasawChileanChineseChippewaChoctawColombianColvilleComancheCosta RicanCreeCreekCroatianCrowCubanCypriotCzechCzechoslovakianDanishDelawareDominicanDutchDutch West IndianEastern EuropeanEcuadorianEgyptianEnglishEstonianEthiopianEuropeanFijianFilipinoFinnishFrenchFrench American IndianFrench CanadianGermanGerman RussianGhanaianGreekGuamanian/ChamorroGuatemalanGuyaneseHaitianHmongHonduranHopiHoumaHungarianIcelanderIndian (Asian)IndonesianInupiatIranianIraqiIrishIroquoisIsraeliItalianJamaicanJapaneseJordanianKenyanKiowaKoreanLaotianLatvianLebaneseLiberianLithuanianLumbeeLuxembourgerMacedonianMalaysianMalteseMarshalleseMenomineeMexicanMexican American IndianMongolianMoroccanNative HawaiianNavajoNepaleseNew ZealanderNicaraguanNigerianNorthern EuropeanNorwegianOkinawanOsageOttawaPaiutePakistaniPalestinianPanamanianParaguayanPennsylvania GermanPeruvianPimaPolishPortuguesePotawatomiPuebloPuerto RicanPuget Sound SalishRomanianRussianSalvadoranSamoanScandinavianScotch-IrishScottishSeminoleSenegaleseSerbianShoshoneSierra LeoneanSiouxSlavicSlovakSloveneSomaliSouth AfricanSouth AmericanSouth American IndianSoviet UnionSpaniardSpanishSpanish AmericanSpanish American IndianSri LankanSubsaharan AfricanSudaneseSwedishSwissSyrianTaiwaneseThaiTlingit-HaidaTohono O'OdhamTonganTrinidadian and TobagonianTsimshianTurkishU.S. Virgin IslanderUgandanUkrainianUruguayanUteVenezuelanVietnameseWelshWest IndianYakamaYaquiYugoslavianYumanYup'ikZimbabwean
Immigration
NonimmigrantsImmigrantsAfghanistanAfricaAlbaniaArgentinaArmeniaAsiaAustraliaAustriaBahamasBangladeshBarbadosBelarusBelgiumBelizeBoliviaBosnia and HerzegovinaBrazilBulgariaBurma/MyanmarCabo VerdeCambodiaCameroonCanadaCaribbeanCentral AmericaChileChinaColombiaCongoCosta RicaCroatiaCubaCzechoslovakiaDenmarkDominicaDominican RepublicEastern AfricaEastern AsiaEastern EuropeEcuadorEgyptEl SalvadorEnglandEritreaEthiopiaEuropeFijiFranceGermanyGhanaGreeceGrenadaGuatemalaGuyanaHaitiHondurasHong KongHungaryIndiaIndonesiaIranIraqIrelandIsraelItalyJamaicaJapanJordanKazakhstanKenyaKoreaKuwaitLaosLatin AmericaLatviaLebanonLiberiaLithuaniaMalaysiaMexicoMicronesiaMiddle AfricaMoldovaMoroccoNepalNetherlandsNicaraguaNigeriaNorth AmericaNorth MacedoniaNorthern AfricaNorthern EuropeNorwayOceaniaPakistanPanamaPeruPhilippinesPolandPortugalRomaniaRussiaSaudi ArabiaScotlandSenegalSerbiaSierra LeoneSingaporeSomaliaSouth AfricaSouth AmericaSouth Central AsiaSouth Eastern AsiaSouthern EuropeSpainSri LankaSt. Vincent and the GrenadinesSudanSwedenSwitzerlandSyriaTaiwanThailandTrinidad and TobagoTurkeyUgandaUkraineUruguayUzbekistanVenezuelaVietnamWest IndiesWestern AfricaWestern AsiaWestern EuropeYemenZaireZimbabweAzores
Select to Compare
Race
Ancestry
AfghanAfricanAlaska NativeAlaskan AthabascanAlbanianAleutAlsatianAmericanApacheArabArapahoArgentineanArmenianAssyrian/Chaldean/SyriacAustralianAustrianBahamianBangladeshiBarbadianBasqueBelgianBelizeanBermudanBhutaneseBlackfeetBolivianBrazilianBritishBritish West IndianBulgarianBurmeseCajunCambodianCanadianCape VerdeanCarpatho RusynCelticCentral AmericanCentral American IndianCherokeeCheyenneChickasawChileanChineseChoctawColombianColvilleComancheCosta RicanCreeCreekCroatianCrowCubanCypriotCzechCzechoslovakianDanishDelawareDominicanDutchDutch West IndianEastern EuropeanEcuadorianEgyptianEnglishEstonianEthiopianEuropeanFijianFilipinoFinnishFrenchFrench American IndianFrench CanadianGermanGerman RussianGhanaianGreekGuamanian/ChamorroGuatemalanGuyaneseHaitianHmongHonduranHopiHoumaHungarianIcelanderIndian (Asian)IndonesianInupiatIranianIraqiIrishIroquoisIsraeliItalianJamaicanJapaneseJordanianKenyanKiowaKoreanLaotianLatvianLebaneseLiberianLithuanianLumbeeLuxembourgerMacedonianMalaysianMalteseMarshalleseMenomineeMexicanMexican American IndianMongolianMoroccanNative HawaiianNavajoNepaleseNew ZealanderNicaraguanNigerianNorthern EuropeanNorwegianOkinawanOsageOttawaPaiutePakistaniPalestinianPanamanianParaguayanPennsylvania GermanPeruvianPimaPolishPortuguesePotawatomiPuebloPuerto RicanPuget Sound SalishRomanianRussianSalvadoranSamoanScandinavianScotch-IrishScottishSeminoleSenegaleseSerbianShoshoneSierra LeoneanSiouxSlavicSlovakSloveneSomaliSouth AfricanSouth AmericanSouth American IndianSoviet UnionSpaniardSpanishSpanish AmericanSpanish American IndianSri LankanSubsaharan AfricanSudaneseSwedishSwissSyrianTaiwaneseThaiTlingit-HaidaTohono O'OdhamTonganTrinidadian and TobagonianTsimshianTurkishU.S. Virgin IslanderUgandanUkrainianUruguayanUteVenezuelanVietnameseWelshWest IndianYakamaYaquiYugoslavianYumanYup'ikZimbabwean
Immigration
NonimmigrantsImmigrantsAfghanistanAfricaAlbaniaArgentinaArmeniaAsiaAustraliaAustriaBahamasBangladeshBarbadosBelarusBelgiumBelizeBoliviaBosnia and HerzegovinaBrazilBulgariaBurma/MyanmarCabo VerdeCambodiaCameroonCanadaCaribbeanCentral AmericaChileChinaColombiaCongoCosta RicaCroatiaCubaCzechoslovakiaDenmarkDominicaDominican RepublicEastern AfricaEastern AsiaEastern EuropeEcuadorEgyptEl SalvadorEnglandEritreaEthiopiaEuropeFijiFranceGermanyGhanaGreeceGrenadaGuatemalaGuyanaHaitiHondurasHong KongHungaryIndiaIndonesiaIranIraqIrelandIsraelItalyJamaicaJapanJordanKazakhstanKenyaKoreaKuwaitLaosLatin AmericaLatviaLebanonLiberiaLithuaniaMalaysiaMexicoMicronesiaMiddle AfricaMoldovaMoroccoNepalNetherlandsNicaraguaNigeriaNorth AmericaNorth MacedoniaNorthern AfricaNorthern EuropeNorwayOceaniaPakistanPanamaPeruPhilippinesPolandPortugalRomaniaRussiaSaudi ArabiaScotlandSenegalSerbiaSierra LeoneSingaporeSomaliaSouth AfricaSouth AmericaSouth Central AsiaSouth Eastern AsiaSouthern EuropeSpainSri LankaSt. Vincent and the GrenadinesSudanSwedenSwitzerlandSyriaTaiwanThailandTrinidad and TobagoTurkeyUgandaUkraineUruguayUzbekistanVenezuelaVietnamWest IndiesWestern AfricaWestern AsiaWestern EuropeYemenZaireZimbabweAzores
Disability Age Under 5
Income
Poverty
Unemployment
Labor Participation
Family Structure
Vehicle Availability
Education Level
Disability

Chippewa Disability Age Under 5
Tragic

1.9%
DISABILITY | AGE UNDER 5
0.0/ 100
METRIC RATING
332nd/ 347
METRIC RANK

Chippewa Disability Age Under 5 Correlation Chart

The statistical analysis conducted on geographies consisting of 140,016,256 people shows a mild positive correlation between the proportion of Chippewa and percentage of population with a disability under the age of 5 in the United States with a correlation coefficient (R) of 0.399 and weighted average of 1.9%. On average, for every 1% (one percent) increase in Chippewa within a typical geography, there is an increase of 0.059% in percentage of population with a disability under the age of 5.
Chippewa Disability Age Under 5
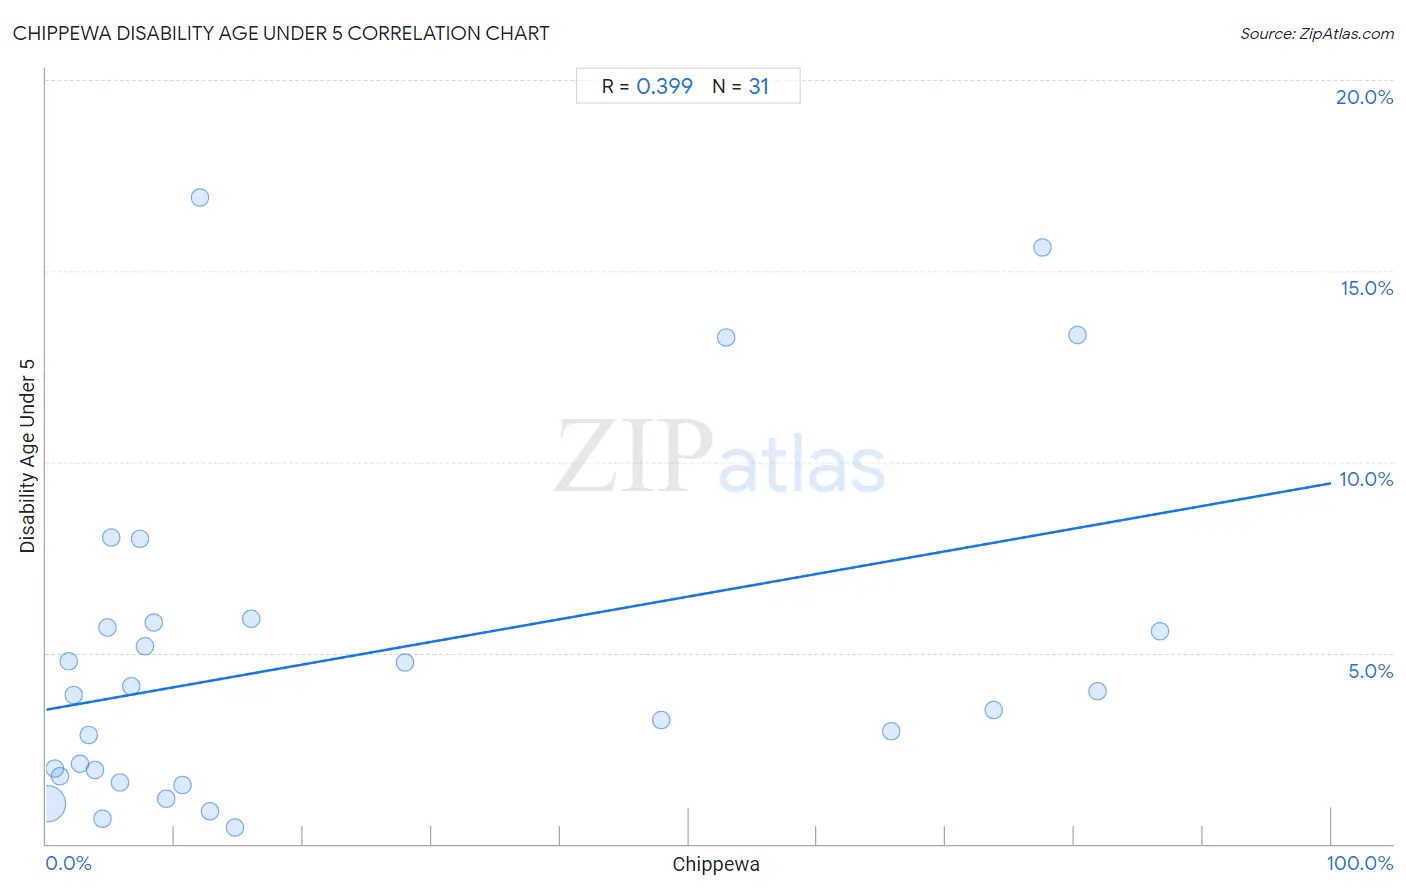
It is essential to understand that the correlation between the percentage of Chippewa and percentage of population with a disability under the age of 5 does not imply a direct cause-and-effect relationship. It remains uncertain whether the presence of Chippewa influences an upward or downward trend in the level of percentage of population with a disability under the age of 5 within an area, or if Chippewa simply ended up residing in those areas with higher or lower levels of percentage of population with a disability under the age of 5 due to other factors.

Demographics Similar to Chippewa by Disability Age Under 5

In terms of disability age under 5, the demographic groups most similar to Chippewa are French Canadian (1.9%, a difference of 0.060%), Choctaw (1.9%, a difference of 0.36%), Houma (1.9%, a difference of 0.69%), American (1.9%, a difference of 1.2%), and Osage (1.8%, a difference of 2.9%).
DemographicsRating | RankDisability Age Under 5
Immigrants from Portugal
0.0
/100
|
#325
Tragic
1.8%
Sioux
0.0
/100
|
#326
Tragic
1.8%
Osage
0.0
/100
|
#327
Tragic
1.8%
Americans
0.0
/100
|
#328
Tragic
1.9%
Houma
0.0
/100
|
#329
Tragic
1.9%
Choctaw
0.0
/100
|
#330
Tragic
1.9%
French Canadians
0.0
/100
|
#331
Tragic
1.9%
Chippewa
0.0
/100
|
#332
Tragic
1.9%
Dutch West Indians
0.0
/100
|
#333
Tragic
1.9%
Natives/Alaskans
0.0
/100
|
#334
Tragic
1.9%
Pennsylvania Germans
0.0
/100
|
#335
Tragic
1.9%
Paraguayans
0.0
/100
|
#336
Tragic
2.0%
Apache
0.0
/100
|
#337
Tragic
2.0%
Tohono O'odham
0.0
/100
|
#338
Tragic
2.2%
Immigrants from the Azores
0.0
/100
|
#339
Tragic
2.2%

Chippewa Disability Age Under 5 Correlation Summary

MeasurementChippewa DataDisability Age Under 5 Data
Minimum0.050%0.43%
Maximum86.7%16.9%
Range86.6%16.5%
Mean23.7%4.9%
Median8.4%3.9%
Interquartile 25% (IQ1)3.8%1.8%
Interquartile 75% (IQ3)47.8%5.8%
Interquartile Range (IQR)44.1%4.0%
Standard Deviation (Sample)29.5%4.4%
Standard Deviation (Population)29.1%4.3%

Correlation Details

Chippewa PercentileSample SizeDisability Age Under 5
[
0.0%
-
0.5%
]
0.050%
136,320,1711.1%
[
0.5%
-
1.0%
]
0.70%
2,381,2212.0%
[
1.0%
-
1.5%
]
1.07%
730,0401.8%
[
1.5%
-
2.0%
]
1.78%
109,2894.8%
[
2.0%
-
2.5%
]
2.13%
121,4953.9%
[
2.5%
-
3.0%
]
2.60%
151,7782.1%
[
3.0%
-
3.5%
]
3.30%
12,7662.8%
[
3.5%
-
4.0%
]
3.77%
21,3661.9%
[
4.0%
-
4.5%
]
4.38%
52,3050.65%
[
4.5%
-
5.0%
]
4.76%
1,0515.7%
[
5.0%
-
5.5%
]
5.05%
6,3358.0%
[
5.5%
-
6.0%
]
5.70%
7,7071.6%
[
6.5%
-
7.0%
]
6.65%
1,8354.1%
[
7.0%
-
7.5%
]
7.34%
3,3388.0%
[
7.5%
-
8.0%
]
7.69%
1,6385.2%
[
8.0%
-
8.5%
]
8.41%
6185.8%
[
9.0%
-
9.5%
]
9.37%
37,1401.2%
[
10.5%
-
11.0%
]
10.63%
34,4321.5%
[
11.5%
-
12.0%
]
11.93%
79616.9%
[
12.5%
-
13.0%
]
12.76%
4,4820.86%
[
14.5%
-
15.0%
]
14.71%
3,8890.43%
[
15.5%
-
16.0%
]
15.98%
7075.9%
[
27.5%
-
28.0%
]
27.92%
4,4994.8%
[
47.5%
-
48.0%
]
47.84%
6483.2%
[
52.5%
-
53.0%
]
52.88%
2,96913.3%
[
65.5%
-
66.0%
]
65.71%
5252.9%
[
73.5%
-
74.0%
]
73.74%
6133.5%
[
77.5%
-
78.0%
]
77.55%
1,75515.6%
[
80.0%
-
80.5%
]
80.22%
9113.3%
[
81.5%
-
82.0%
]
81.78%
4724.0%
[
86.5%
-
87.0%
]
86.67%
2855.6%