Ghanaian Disability Age Under 5
COMPARE
Ghanaian
Select to Compare
Disability Age Under 5
Ghanaian Disability Age Under 5
1.2%
DISABILITY | AGE UNDER 5
76.3/ 100
METRIC RATING
148th/ 347
METRIC RANK
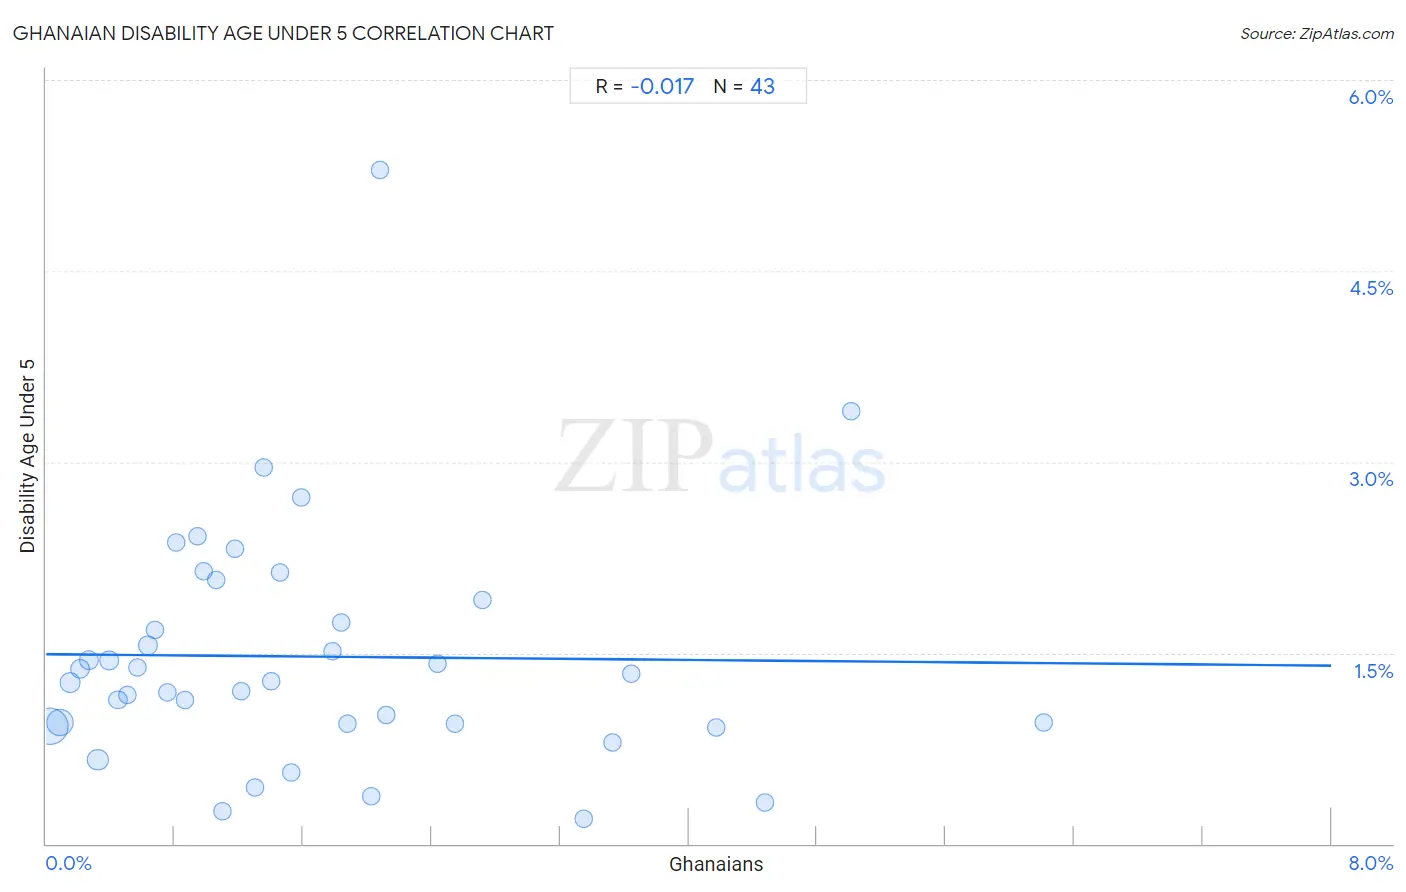
Ghanaian Disability Age Under 5 Correlation Chart
The statistical analysis conducted on geographies consisting of 127,583,107 people shows no correlation between the proportion of Ghanaians and percentage of population with a disability under the age of 5 in the United States with a correlation coefficient (R) of -0.017 and weighted average of 1.2%. On average, for every 1% (one percent) increase in Ghanaians within a typical geography, there is a decrease of 0.011% in percentage of population with a disability under the age of 5.
It is essential to understand that the correlation between the percentage of Ghanaians and percentage of population with a disability under the age of 5 does not imply a direct cause-and-effect relationship. It remains uncertain whether the presence of Ghanaians influences an upward or downward trend in the level of percentage of population with a disability under the age of 5 within an area, or if Ghanaians simply ended up residing in those areas with higher or lower levels of percentage of population with a disability under the age of 5 due to other factors.
Demographics Similar to Ghanaians by Disability Age Under 5
In terms of disability age under 5, the demographic groups most similar to Ghanaians are Icelander (1.2%, a difference of 0.010%), Kenyan (1.2%, a difference of 0.050%), South American (1.2%, a difference of 0.090%), Samoan (1.2%, a difference of 0.19%), and Yaqui (1.2%, a difference of 0.19%).
| Demographics | Rating | Rank | Disability Age Under 5 |
| Immigrants from Honduras | 80.4 /100 | #141 | Excellent 1.2% |
| Immigrants from Colombia | 79.3 /100 | #142 | Good 1.2% |
| Alsatians | 79.3 /100 | #143 | Good 1.2% |
| Immigrants from Middle Africa | 79.3 /100 | #144 | Good 1.2% |
| Immigrants from Zimbabwe | 77.9 /100 | #145 | Good 1.2% |
| Samoans | 77.7 /100 | #146 | Good 1.2% |
| Icelanders | 76.3 /100 | #147 | Good 1.2% |
| Ghanaians | 76.3 /100 | #148 | Good 1.2% |
| Kenyans | 75.9 /100 | #149 | Good 1.2% |
| South Americans | 75.6 /100 | #150 | Good 1.2% |
| Yaqui | 74.8 /100 | #151 | Good 1.2% |
| Hondurans | 72.5 /100 | #152 | Good 1.2% |
| Immigrants from Thailand | 69.4 /100 | #153 | Good 1.2% |
| Uruguayans | 68.8 /100 | #154 | Good 1.2% |
| Immigrants from Ghana | 68.7 /100 | #155 | Good 1.2% |
Ghanaian Disability Age Under 5 Correlation Summary
| Measurement | Ghanaian Data | Disability Age Under 5 Data |
| Minimum | 0.027% | 0.20% |
| Maximum | 6.2% | 5.3% |
| Range | 6.2% | 5.1% |
| Mean | 1.7% | 1.5% |
| Median | 1.3% | 1.3% |
| Interquartile 25% (IQ1) | 0.63% | 0.94% |
| Interquartile 75% (IQ3) | 2.1% | 1.9% |
| Interquartile Range (IQR) | 1.5% | 0.97% |
| Standard Deviation (Sample) | 1.4% | 0.94% |
| Standard Deviation (Population) | 1.4% | 0.93% |
Correlation Details
| Ghanaian Percentile | Sample Size | Disability Age Under 5 |
[ 0.0% - 0.5% ] 0.027% | 63,351,724 | 0.93% |
[ 0.0% - 0.5% ] 0.088% | 29,740,490 | 0.96% |
[ 0.0% - 0.5% ] 0.15% | 7,903,220 | 1.3% |
[ 0.0% - 0.5% ] 0.21% | 3,813,527 | 1.4% |
[ 0.0% - 0.5% ] 0.27% | 2,985,945 | 1.4% |
[ 0.0% - 0.5% ] 0.32% | 10,237,257 | 0.66% |
[ 0.0% - 0.5% ] 0.39% | 1,446,681 | 1.4% |
[ 0.0% - 0.5% ] 0.45% | 1,160,408 | 1.1% |
[ 0.5% - 1.0% ] 0.50% | 612,505 | 1.2% |
[ 0.5% - 1.0% ] 0.57% | 542,178 | 1.4% |
[ 0.5% - 1.0% ] 0.63% | 1,437,471 | 1.6% |
[ 0.5% - 1.0% ] 0.68% | 354,030 | 1.7% |
[ 0.5% - 1.0% ] 0.75% | 665,277 | 1.2% |
[ 0.5% - 1.0% ] 0.81% | 165,544 | 2.4% |
[ 0.5% - 1.0% ] 0.86% | 191,376 | 1.1% |
[ 0.5% - 1.0% ] 0.94% | 40,376 | 2.4% |
[ 0.5% - 1.0% ] 0.98% | 199,255 | 2.1% |
[ 1.0% - 1.5% ] 1.06% | 322,921 | 2.1% |
[ 1.0% - 1.5% ] 1.10% | 61,922 | 0.25% |
[ 1.0% - 1.5% ] 1.17% | 167,921 | 2.3% |
[ 1.0% - 1.5% ] 1.22% | 217,026 | 1.2% |
[ 1.0% - 1.5% ] 1.30% | 35,795 | 0.44% |
[ 1.0% - 1.5% ] 1.36% | 132,512 | 3.0% |
[ 1.0% - 1.5% ] 1.40% | 198,128 | 1.3% |
[ 1.0% - 1.5% ] 1.46% | 108,222 | 2.1% |
[ 1.5% - 2.0% ] 1.52% | 36,847 | 0.56% |
[ 1.5% - 2.0% ] 1.59% | 124,916 | 2.7% |
[ 1.5% - 2.0% ] 1.78% | 56,061 | 1.5% |
[ 1.5% - 2.0% ] 1.83% | 220,561 | 1.7% |
[ 1.5% - 2.0% ] 1.88% | 219,960 | 0.94% |
[ 2.0% - 2.5% ] 2.02% | 82,678 | 0.38% |
[ 2.0% - 2.5% ] 2.08% | 33,350 | 5.3% |
[ 2.0% - 2.5% ] 2.12% | 54,209 | 1.0% |
[ 2.0% - 2.5% ] 2.43% | 58,688 | 1.4% |
[ 2.5% - 3.0% ] 2.55% | 204,191 | 0.94% |
[ 2.5% - 3.0% ] 2.71% | 158,441 | 1.9% |
[ 3.0% - 3.5% ] 3.35% | 16,620 | 0.20% |
[ 3.5% - 4.0% ] 3.52% | 36,265 | 0.79% |
[ 3.5% - 4.0% ] 3.64% | 22,966 | 1.3% |
[ 4.0% - 4.5% ] 4.17% | 30,590 | 0.91% |
[ 4.0% - 4.5% ] 4.47% | 72,215 | 0.32% |
[ 5.0% - 5.5% ] 5.01% | 40,724 | 3.4% |
[ 6.0% - 6.5% ] 6.21% | 22,114 | 0.95% |