Bahamian Disability Age Under 5
COMPARE
Bahamian
Select to Compare
Disability Age Under 5
Bahamian Disability Age Under 5
1.3%
DISABILITY | AGE UNDER 5
7.1/ 100
METRIC RATING
226th/ 347
METRIC RANK
Bahamian Disability Age Under 5 Correlation Chart
The statistical analysis conducted on geographies consisting of 81,811,004 people shows a mild positive correlation between the proportion of Bahamians and percentage of population with a disability under the age of 5 in the United States with a correlation coefficient (R) of 0.397 and weighted average of 1.3%. On average, for every 1% (one percent) increase in Bahamians within a typical geography, there is an increase of 0.58% in percentage of population with a disability under the age of 5.
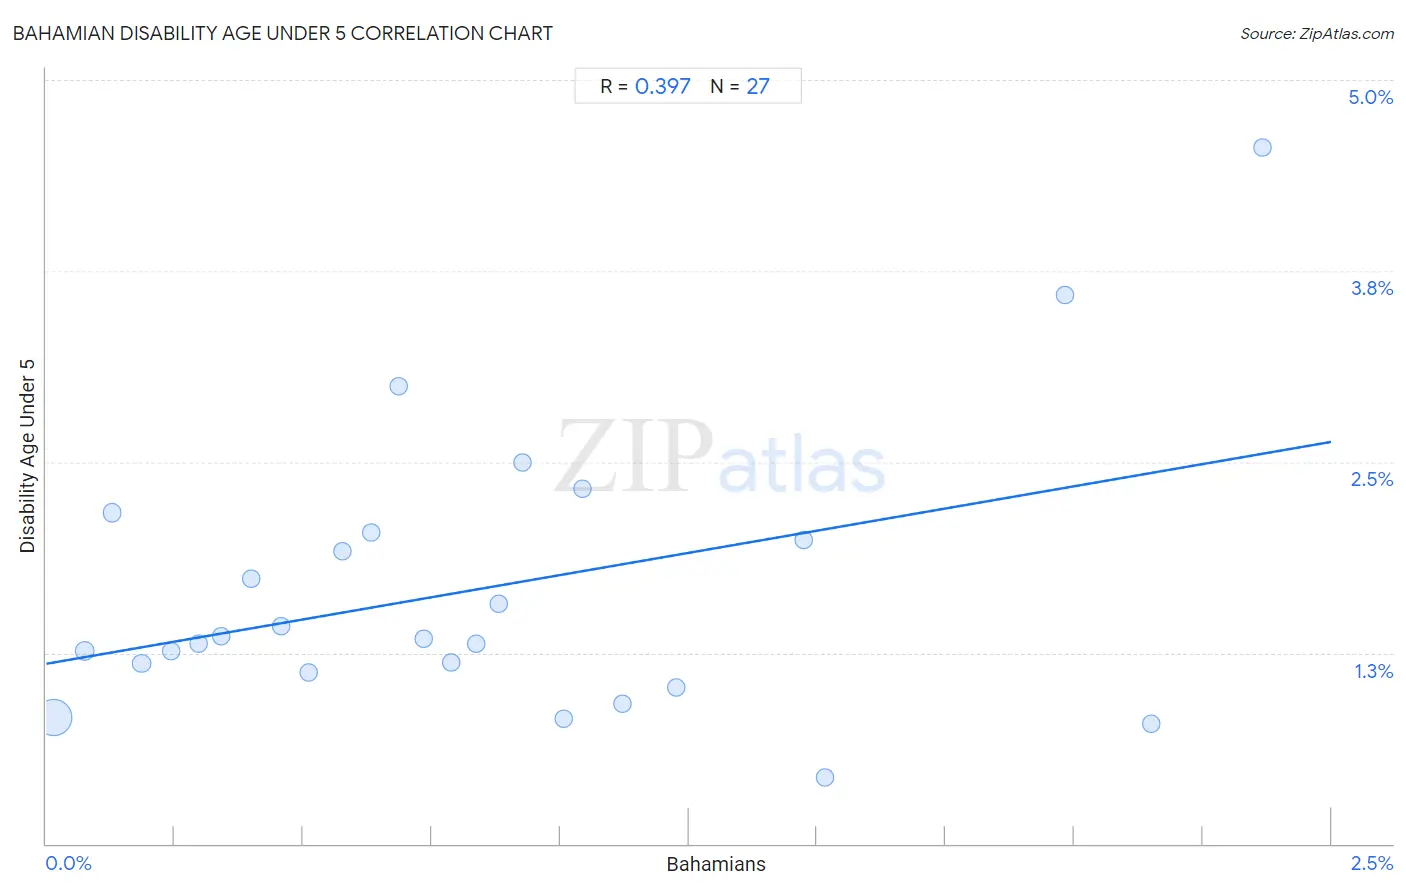
It is essential to understand that the correlation between the percentage of Bahamians and percentage of population with a disability under the age of 5 does not imply a direct cause-and-effect relationship. It remains uncertain whether the presence of Bahamians influences an upward or downward trend in the level of percentage of population with a disability under the age of 5 within an area, or if Bahamians simply ended up residing in those areas with higher or lower levels of percentage of population with a disability under the age of 5 due to other factors.
Demographics Similar to Bahamians by Disability Age Under 5
In terms of disability age under 5, the demographic groups most similar to Bahamians are Panamanian (1.3%, a difference of 0.0%), Latvian (1.3%, a difference of 0.030%), Hispanic or Latino (1.3%, a difference of 0.19%), Taiwanese (1.3%, a difference of 0.34%), and Luxembourger (1.3%, a difference of 0.35%).
| Demographics | Rating | Rank | Disability Age Under 5 |
| Immigrants from Croatia | 11.2 /100 | #219 | Poor 1.3% |
| Serbians | 9.6 /100 | #220 | Tragic 1.3% |
| Sub-Saharan Africans | 8.3 /100 | #221 | Tragic 1.3% |
| Ukrainians | 8.3 /100 | #222 | Tragic 1.3% |
| Hispanics or Latinos | 7.7 /100 | #223 | Tragic 1.3% |
| Latvians | 7.1 /100 | #224 | Tragic 1.3% |
| Panamanians | 7.1 /100 | #225 | Tragic 1.3% |
| Bahamians | 7.1 /100 | #226 | Tragic 1.3% |
| Taiwanese | 6.1 /100 | #227 | Tragic 1.3% |
| Luxembourgers | 6.1 /100 | #228 | Tragic 1.3% |
| Immigrants from Costa Rica | 5.5 /100 | #229 | Tragic 1.3% |
| Lebanese | 5.3 /100 | #230 | Tragic 1.3% |
| Immigrants from Northern Europe | 4.7 /100 | #231 | Tragic 1.3% |
| French American Indians | 4.5 /100 | #232 | Tragic 1.3% |
| Tongans | 4.2 /100 | #233 | Tragic 1.3% |
Bahamian Disability Age Under 5 Correlation Summary
| Measurement | Bahamian Data | Disability Age Under 5 Data |
| Minimum | 0.015% | 0.43% |
| Maximum | 2.4% | 4.6% |
| Range | 2.4% | 4.1% |
| Mean | 0.84% | 1.7% |
| Median | 0.73% | 1.3% |
| Interquartile 25% (IQ1) | 0.34% | 1.1% |
| Interquartile 75% (IQ3) | 1.1% | 2.0% |
| Interquartile Range (IQR) | 0.78% | 0.92% |
| Standard Deviation (Sample) | 0.63% | 0.92% |
| Standard Deviation (Population) | 0.61% | 0.90% |
Correlation Details
| Bahamian Percentile | Sample Size | Disability Age Under 5 |
[ 0.0% - 0.5% ] 0.015% | 66,315,116 | 0.83% |
[ 0.0% - 0.5% ] 0.075% | 6,599,148 | 1.3% |
[ 0.0% - 0.5% ] 0.13% | 2,669,231 | 2.2% |
[ 0.0% - 0.5% ] 0.19% | 1,901,549 | 1.2% |
[ 0.0% - 0.5% ] 0.24% | 565,586 | 1.3% |
[ 0.0% - 0.5% ] 0.30% | 788,710 | 1.3% |
[ 0.0% - 0.5% ] 0.34% | 346,014 | 1.4% |
[ 0.0% - 0.5% ] 0.40% | 302,966 | 1.7% |
[ 0.0% - 0.5% ] 0.46% | 422,004 | 1.4% |
[ 0.5% - 1.0% ] 0.51% | 285,569 | 1.1% |
[ 0.5% - 1.0% ] 0.58% | 300,304 | 1.9% |
[ 0.5% - 1.0% ] 0.63% | 175,037 | 2.0% |
[ 0.5% - 1.0% ] 0.68% | 109,406 | 3.0% |
[ 0.5% - 1.0% ] 0.73% | 68,032 | 1.3% |
[ 0.5% - 1.0% ] 0.79% | 177,553 | 1.2% |
[ 0.5% - 1.0% ] 0.84% | 230,871 | 1.3% |
[ 0.5% - 1.0% ] 0.88% | 50,946 | 1.6% |
[ 0.5% - 1.0% ] 0.93% | 71,749 | 2.5% |
[ 1.0% - 1.5% ] 1.01% | 169,383 | 0.82% |
[ 1.0% - 1.5% ] 1.04% | 1,054 | 2.3% |
[ 1.0% - 1.5% ] 1.12% | 42,249 | 0.92% |
[ 1.0% - 1.5% ] 1.23% | 31,590 | 1.0% |
[ 1.0% - 1.5% ] 1.47% | 16,230 | 2.0% |
[ 1.5% - 2.0% ] 1.51% | 111,618 | 0.43% |
[ 1.5% - 2.0% ] 1.98% | 14,126 | 3.6% |
[ 2.0% - 2.5% ] 2.15% | 37,274 | 0.78% |
[ 2.0% - 2.5% ] 2.37% | 7,689 | 4.6% |