Iraqi Disability Age Under 5
COMPARE
Iraqi
Select to Compare
Disability Age Under 5
Iraqi Disability Age Under 5
1.2%
DISABILITY | AGE UNDER 5
95.1/ 100
METRIC RATING
108th/ 347
METRIC RANK
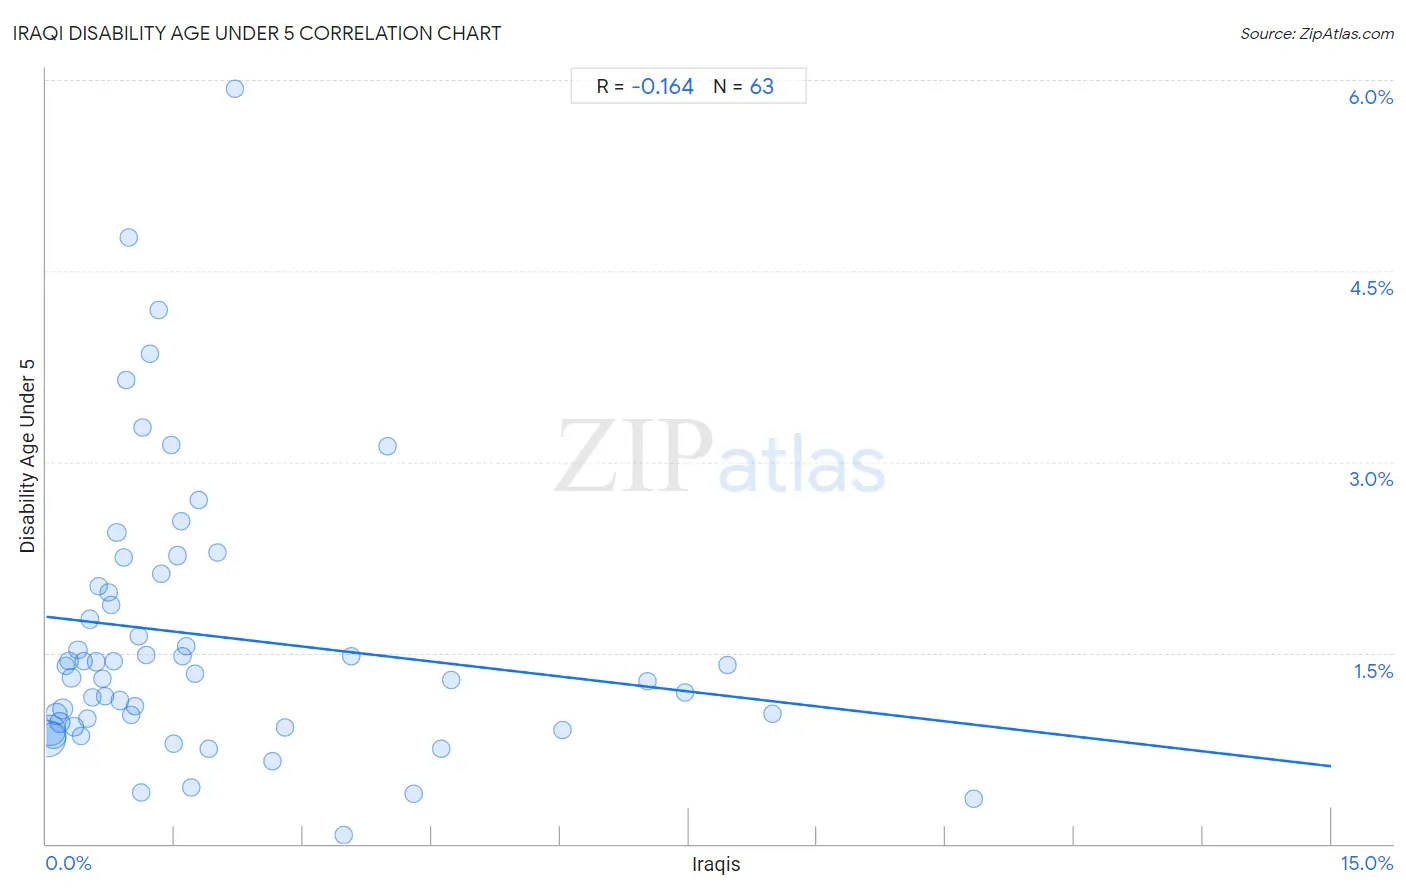
Iraqi Disability Age Under 5 Correlation Chart
The statistical analysis conducted on geographies consisting of 119,151,918 people shows a poor negative correlation between the proportion of Iraqis and percentage of population with a disability under the age of 5 in the United States with a correlation coefficient (R) of -0.164 and weighted average of 1.2%. On average, for every 1% (one percent) increase in Iraqis within a typical geography, there is a decrease of 0.078% in percentage of population with a disability under the age of 5.
It is essential to understand that the correlation between the percentage of Iraqis and percentage of population with a disability under the age of 5 does not imply a direct cause-and-effect relationship. It remains uncertain whether the presence of Iraqis influences an upward or downward trend in the level of percentage of population with a disability under the age of 5 within an area, or if Iraqis simply ended up residing in those areas with higher or lower levels of percentage of population with a disability under the age of 5 due to other factors.
Demographics Similar to Iraqis by Disability Age Under 5
In terms of disability age under 5, the demographic groups most similar to Iraqis are Immigrants from Panama (1.2%, a difference of 0.020%), Immigrants from Lebanon (1.2%, a difference of 0.040%), Immigrants from West Indies (1.2%, a difference of 0.13%), Cambodian (1.2%, a difference of 0.17%), and Senegalese (1.2%, a difference of 0.24%).
| Demographics | Rating | Rank | Disability Age Under 5 |
| Immigrants from Uganda | 96.1 /100 | #101 | Exceptional 1.1% |
| Immigrants from Morocco | 96.0 /100 | #102 | Exceptional 1.2% |
| Immigrants from Nicaragua | 96.0 /100 | #103 | Exceptional 1.2% |
| Indonesians | 95.9 /100 | #104 | Exceptional 1.2% |
| Immigrants from South Africa | 95.6 /100 | #105 | Exceptional 1.2% |
| Cambodians | 95.4 /100 | #106 | Exceptional 1.2% |
| Immigrants from West Indies | 95.3 /100 | #107 | Exceptional 1.2% |
| Iraqis | 95.1 /100 | #108 | Exceptional 1.2% |
| Immigrants from Panama | 95.0 /100 | #109 | Exceptional 1.2% |
| Immigrants from Lebanon | 95.0 /100 | #110 | Exceptional 1.2% |
| Senegalese | 94.6 /100 | #111 | Exceptional 1.2% |
| Immigrants from Australia | 94.4 /100 | #112 | Exceptional 1.2% |
| Immigrants from Oceania | 94.2 /100 | #113 | Exceptional 1.2% |
| Belizeans | 93.9 /100 | #114 | Exceptional 1.2% |
| Immigrants from Caribbean | 93.8 /100 | #115 | Exceptional 1.2% |
Iraqi Disability Age Under 5 Correlation Summary
| Measurement | Iraqi Data | Disability Age Under 5 Data |
| Minimum | 0.018% | 0.070% |
| Maximum | 10.8% | 5.9% |
| Range | 10.8% | 5.9% |
| Mean | 1.9% | 1.6% |
| Median | 1.1% | 1.3% |
| Interquartile 25% (IQ1) | 0.54% | 0.92% |
| Interquartile 75% (IQ3) | 2.0% | 2.0% |
| Interquartile Range (IQR) | 1.5% | 1.1% |
| Standard Deviation (Sample) | 2.3% | 1.1% |
| Standard Deviation (Population) | 2.3% | 1.1% |
Correlation Details
| Iraqi Percentile | Sample Size | Disability Age Under 5 |
[ 0.0% - 0.5% ] 0.018% | 42,255,184 | 0.83% |
[ 0.0% - 0.5% ] 0.048% | 26,610,282 | 0.89% |
[ 0.0% - 0.5% ] 0.085% | 17,875,915 | 0.85% |
[ 0.0% - 0.5% ] 0.12% | 7,583,352 | 1.0% |
[ 0.0% - 0.5% ] 0.16% | 5,878,731 | 0.95% |
[ 0.0% - 0.5% ] 0.19% | 4,751,294 | 1.1% |
[ 0.0% - 0.5% ] 0.23% | 1,907,991 | 1.4% |
[ 0.0% - 0.5% ] 0.27% | 1,381,490 | 1.4% |
[ 0.0% - 0.5% ] 0.30% | 1,888,749 | 1.3% |
[ 0.0% - 0.5% ] 0.33% | 832,271 | 0.92% |
[ 0.0% - 0.5% ] 0.37% | 562,230 | 1.5% |
[ 0.0% - 0.5% ] 0.40% | 1,256,726 | 0.85% |
[ 0.0% - 0.5% ] 0.43% | 413,026 | 1.4% |
[ 0.0% - 0.5% ] 0.48% | 519,196 | 0.98% |
[ 0.5% - 1.0% ] 0.51% | 402,481 | 1.8% |
[ 0.5% - 1.0% ] 0.54% | 512,212 | 1.1% |
[ 0.5% - 1.0% ] 0.58% | 346,596 | 1.4% |
[ 0.5% - 1.0% ] 0.62% | 361,604 | 2.0% |
[ 0.5% - 1.0% ] 0.65% | 202,453 | 1.3% |
[ 0.5% - 1.0% ] 0.68% | 111,730 | 1.2% |
[ 0.5% - 1.0% ] 0.72% | 335,090 | 2.0% |
[ 0.5% - 1.0% ] 0.76% | 324,345 | 1.9% |
[ 0.5% - 1.0% ] 0.78% | 142,707 | 1.4% |
[ 0.5% - 1.0% ] 0.82% | 107,019 | 2.4% |
[ 0.5% - 1.0% ] 0.86% | 440,344 | 1.1% |
[ 0.5% - 1.0% ] 0.90% | 71,465 | 2.2% |
[ 0.5% - 1.0% ] 0.93% | 14,739 | 3.6% |
[ 0.5% - 1.0% ] 0.96% | 12,737 | 4.8% |
[ 0.5% - 1.0% ] 0.99% | 163,496 | 1.0% |
[ 1.0% - 1.5% ] 1.03% | 76,048 | 1.1% |
[ 1.0% - 1.5% ] 1.07% | 54,300 | 1.6% |
[ 1.0% - 1.5% ] 1.10% | 138,206 | 0.41% |
[ 1.0% - 1.5% ] 1.13% | 28,639 | 3.3% |
[ 1.0% - 1.5% ] 1.17% | 44,410 | 1.5% |
[ 1.0% - 1.5% ] 1.21% | 1,572 | 3.8% |
[ 1.0% - 1.5% ] 1.31% | 54,393 | 4.2% |
[ 1.0% - 1.5% ] 1.34% | 53,987 | 2.1% |
[ 1.0% - 1.5% ] 1.45% | 25,843 | 3.1% |
[ 1.0% - 1.5% ] 1.49% | 138,588 | 0.78% |
[ 1.5% - 2.0% ] 1.54% | 178,276 | 2.3% |
[ 1.5% - 2.0% ] 1.57% | 86,825 | 2.5% |
[ 1.5% - 2.0% ] 1.59% | 30,864 | 1.5% |
[ 1.5% - 2.0% ] 1.63% | 67,076 | 1.6% |
[ 1.5% - 2.0% ] 1.70% | 24,441 | 0.44% |
[ 1.5% - 2.0% ] 1.73% | 35,415 | 1.3% |
[ 1.5% - 2.0% ] 1.78% | 29,330 | 2.7% |
[ 1.5% - 2.0% ] 1.90% | 40,923 | 0.75% |
[ 1.5% - 2.0% ] 2.00% | 13,171 | 2.3% |
[ 2.0% - 2.5% ] 2.20% | 12,593 | 5.9% |
[ 2.5% - 3.0% ] 2.64% | 57,510 | 0.65% |
[ 2.5% - 3.0% ] 2.78% | 30,590 | 0.91% |
[ 3.0% - 3.5% ] 3.48% | 27,848 | 0.070% |
[ 3.5% - 4.0% ] 3.56% | 34,921 | 1.5% |
[ 3.5% - 4.0% ] 3.98% | 6,607 | 3.1% |
[ 4.0% - 4.5% ] 4.28% | 45,937 | 0.40% |
[ 4.5% - 5.0% ] 4.61% | 133,744 | 0.75% |
[ 4.5% - 5.0% ] 4.73% | 69,638 | 1.3% |
[ 6.0% - 6.5% ] 6.02% | 62,474 | 0.89% |
[ 7.0% - 7.5% ] 7.02% | 105,721 | 1.3% |
[ 7.0% - 7.5% ] 7.46% | 59,775 | 1.2% |
[ 7.5% - 8.0% ] 7.95% | 40,392 | 1.4% |
[ 8.0% - 8.5% ] 8.48% | 43,232 | 1.0% |
[ 10.5% - 11.0% ] 10.82% | 33,174 | 0.35% |