Vietnamese Disability Age Under 5

COMPARE

Vietnamese
Race
Ancestry
AfghanAfricanAlaska NativeAlaskan AthabascanAlbanianAleutAlsatianAmericanApacheArabArapahoArgentineanArmenianAssyrian/Chaldean/SyriacAustralianAustrianBahamianBangladeshiBarbadianBasqueBelgianBelizeanBermudanBhutaneseBlackfeetBolivianBrazilianBritishBritish West IndianBulgarianBurmeseCajunCambodianCanadianCape VerdeanCarpatho RusynCelticCentral AmericanCentral American IndianCherokeeCheyenneChickasawChileanChineseChippewaChoctawColombianColvilleComancheCosta RicanCreeCreekCroatianCrowCubanCypriotCzechCzechoslovakianDanishDelawareDominicanDutchDutch West IndianEastern EuropeanEcuadorianEgyptianEnglishEstonianEthiopianEuropeanFijianFilipinoFinnishFrenchFrench American IndianFrench CanadianGermanGerman RussianGhanaianGreekGuamanian/ChamorroGuatemalanGuyaneseHaitianHmongHonduranHopiHoumaHungarianIcelanderIndian (Asian)IndonesianInupiatIranianIraqiIrishIroquoisIsraeliItalianJamaicanJapaneseJordanianKenyanKiowaKoreanLaotianLatvianLebaneseLiberianLithuanianLumbeeLuxembourgerMacedonianMalaysianMalteseMarshalleseMenomineeMexicanMexican American IndianMongolianMoroccanNative HawaiianNavajoNepaleseNew ZealanderNicaraguanNigerianNorthern EuropeanNorwegianOkinawanOsageOttawaPaiutePakistaniPalestinianPanamanianParaguayanPennsylvania GermanPeruvianPimaPolishPortuguesePotawatomiPuebloPuerto RicanPuget Sound SalishRomanianRussianSalvadoranSamoanScandinavianScotch-IrishScottishSeminoleSenegaleseSerbianShoshoneSierra LeoneanSiouxSlavicSlovakSloveneSomaliSouth AfricanSouth AmericanSouth American IndianSoviet UnionSpaniardSpanishSpanish AmericanSpanish American IndianSri LankanSubsaharan AfricanSudaneseSwedishSwissSyrianTaiwaneseThaiTlingit-HaidaTohono O'OdhamTonganTrinidadian and TobagonianTsimshianTurkishU.S. Virgin IslanderUgandanUkrainianUruguayanUteVenezuelanVietnameseWelshWest IndianYakamaYaquiYugoslavianYumanYup'ikZimbabwean
Immigration
NonimmigrantsImmigrantsAfghanistanAfricaAlbaniaArgentinaArmeniaAsiaAustraliaAustriaBahamasBangladeshBarbadosBelarusBelgiumBelizeBoliviaBosnia and HerzegovinaBrazilBulgariaBurma/MyanmarCabo VerdeCambodiaCameroonCanadaCaribbeanCentral AmericaChileChinaColombiaCongoCosta RicaCroatiaCubaCzechoslovakiaDenmarkDominicaDominican RepublicEastern AfricaEastern AsiaEastern EuropeEcuadorEgyptEl SalvadorEnglandEritreaEthiopiaEuropeFijiFranceGermanyGhanaGreeceGrenadaGuatemalaGuyanaHaitiHondurasHong KongHungaryIndiaIndonesiaIranIraqIrelandIsraelItalyJamaicaJapanJordanKazakhstanKenyaKoreaKuwaitLaosLatin AmericaLatviaLebanonLiberiaLithuaniaMalaysiaMexicoMicronesiaMiddle AfricaMoldovaMoroccoNepalNetherlandsNicaraguaNigeriaNorth AmericaNorth MacedoniaNorthern AfricaNorthern EuropeNorwayOceaniaPakistanPanamaPeruPhilippinesPolandPortugalRomaniaRussiaSaudi ArabiaScotlandSenegalSerbiaSierra LeoneSingaporeSomaliaSouth AfricaSouth AmericaSouth Central AsiaSouth Eastern AsiaSouthern EuropeSpainSri LankaSt. Vincent and the GrenadinesSudanSwedenSwitzerlandSyriaTaiwanThailandTrinidad and TobagoTurkeyUgandaUkraineUruguayUzbekistanVenezuelaVietnamWest IndiesWestern AfricaWestern AsiaWestern EuropeYemenZaireZimbabweAzores
Select to Compare
Race
Ancestry
AfghanAfricanAlaska NativeAlaskan AthabascanAlbanianAleutAlsatianAmericanApacheArabArapahoArgentineanArmenianAssyrian/Chaldean/SyriacAustralianAustrianBahamianBangladeshiBarbadianBasqueBelgianBelizeanBermudanBhutaneseBlackfeetBolivianBrazilianBritishBritish West IndianBulgarianBurmeseCajunCambodianCanadianCape VerdeanCarpatho RusynCelticCentral AmericanCentral American IndianCherokeeCheyenneChickasawChileanChineseChippewaChoctawColombianColvilleComancheCosta RicanCreeCreekCroatianCrowCubanCypriotCzechCzechoslovakianDanishDelawareDominicanDutchDutch West IndianEastern EuropeanEcuadorianEgyptianEnglishEstonianEthiopianEuropeanFijianFilipinoFinnishFrenchFrench American IndianFrench CanadianGermanGerman RussianGhanaianGreekGuamanian/ChamorroGuatemalanGuyaneseHaitianHmongHonduranHopiHoumaHungarianIcelanderIndian (Asian)IndonesianInupiatIranianIraqiIrishIroquoisIsraeliItalianJamaicanJapaneseJordanianKenyanKiowaKoreanLaotianLatvianLebaneseLiberianLithuanianLumbeeLuxembourgerMacedonianMalaysianMalteseMarshalleseMenomineeMexicanMexican American IndianMongolianMoroccanNative HawaiianNavajoNepaleseNew ZealanderNicaraguanNigerianNorthern EuropeanNorwegianOkinawanOsageOttawaPaiutePakistaniPalestinianPanamanianParaguayanPennsylvania GermanPeruvianPimaPolishPortuguesePotawatomiPuebloPuerto RicanPuget Sound SalishRomanianRussianSalvadoranSamoanScandinavianScotch-IrishScottishSeminoleSenegaleseSerbianShoshoneSierra LeoneanSiouxSlavicSlovakSloveneSomaliSouth AfricanSouth AmericanSouth American IndianSoviet UnionSpaniardSpanishSpanish AmericanSpanish American IndianSri LankanSubsaharan AfricanSudaneseSwedishSwissSyrianTaiwaneseThaiTlingit-HaidaTohono O'OdhamTonganTrinidadian and TobagonianTsimshianTurkishU.S. Virgin IslanderUgandanUkrainianUruguayanUteVenezuelanWelshWest IndianYakamaYaquiYugoslavianYumanYup'ikZimbabwean
Immigration
NonimmigrantsImmigrantsAfghanistanAfricaAlbaniaArgentinaArmeniaAsiaAustraliaAustriaBahamasBangladeshBarbadosBelarusBelgiumBelizeBoliviaBosnia and HerzegovinaBrazilBulgariaBurma/MyanmarCabo VerdeCambodiaCameroonCanadaCaribbeanCentral AmericaChileChinaColombiaCongoCosta RicaCroatiaCubaCzechoslovakiaDenmarkDominicaDominican RepublicEastern AfricaEastern AsiaEastern EuropeEcuadorEgyptEl SalvadorEnglandEritreaEthiopiaEuropeFijiFranceGermanyGhanaGreeceGrenadaGuatemalaGuyanaHaitiHondurasHong KongHungaryIndiaIndonesiaIranIraqIrelandIsraelItalyJamaicaJapanJordanKazakhstanKenyaKoreaKuwaitLaosLatin AmericaLatviaLebanonLiberiaLithuaniaMalaysiaMexicoMicronesiaMiddle AfricaMoldovaMoroccoNepalNetherlandsNicaraguaNigeriaNorth AmericaNorth MacedoniaNorthern AfricaNorthern EuropeNorwayOceaniaPakistanPanamaPeruPhilippinesPolandPortugalRomaniaRussiaSaudi ArabiaScotlandSenegalSerbiaSierra LeoneSingaporeSomaliaSouth AfricaSouth AmericaSouth Central AsiaSouth Eastern AsiaSouthern EuropeSpainSri LankaSt. Vincent and the GrenadinesSudanSwedenSwitzerlandSyriaTaiwanThailandTrinidad and TobagoTurkeyUgandaUkraineUruguayUzbekistanVenezuelaVietnamWest IndiesWestern AfricaWestern AsiaWestern EuropeYemenZaireZimbabweAzores
Disability Age Under 5
Income
Poverty
Unemployment
Labor Participation
Family Structure
Vehicle Availability
Education Level
Disability

Vietnamese Disability Age Under 5
Exceptional

0.81%
DISABILITY | AGE UNDER 5
100.0/ 100
METRIC RATING
3rd/ 347
METRIC RANK

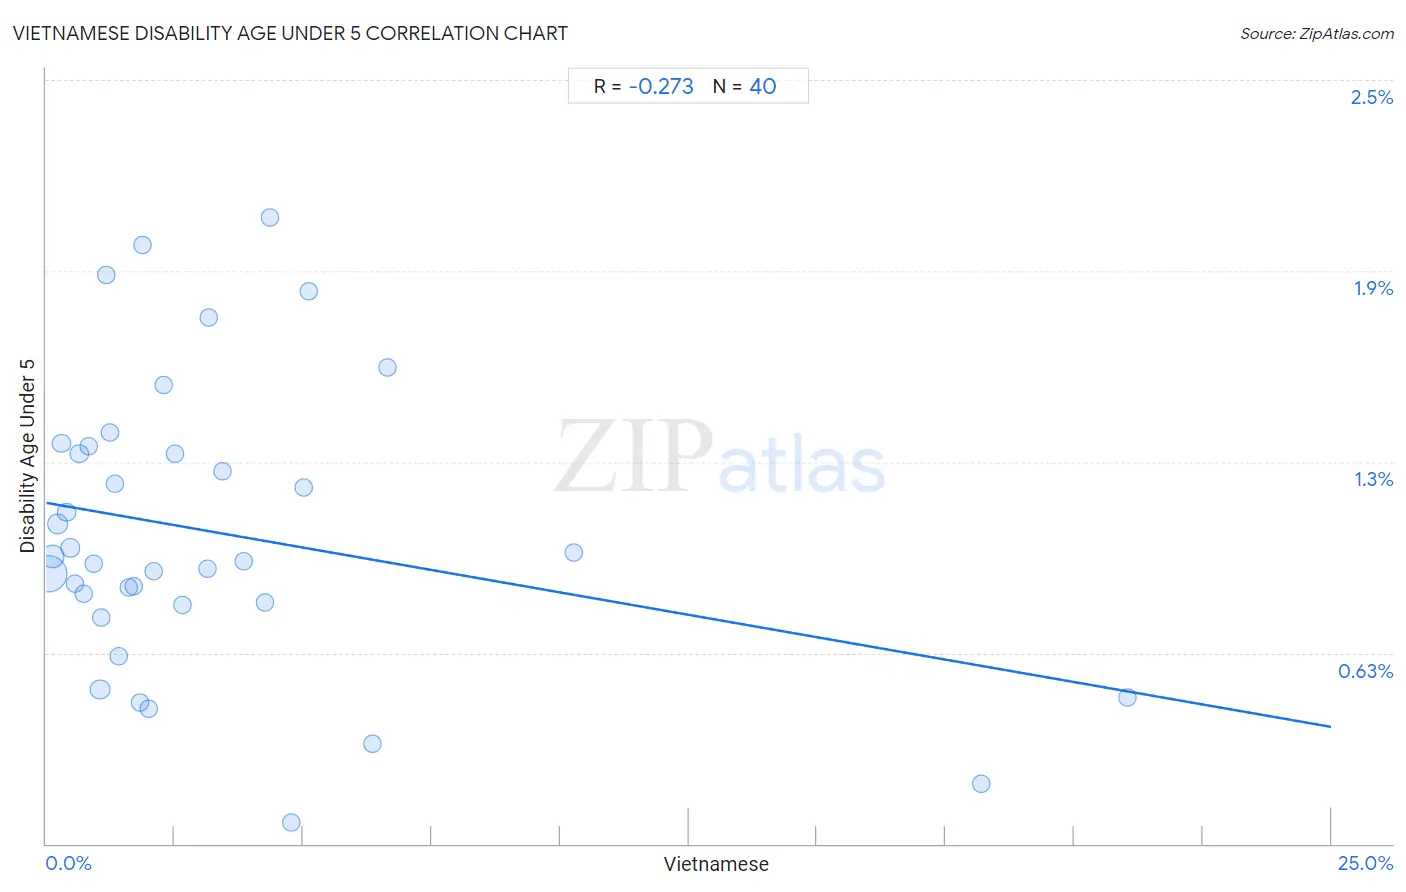
Vietnamese Disability Age Under 5 Correlation Chart

The statistical analysis conducted on geographies consisting of 116,197,167 people shows a weak negative correlation between the proportion of Vietnamese and percentage of population with a disability under the age of 5 in the United States with a correlation coefficient (R) of -0.273 and weighted average of 0.81%. On average, for every 1% (one percent) increase in Vietnamese within a typical geography, there is a decrease of 0.029% in percentage of population with a disability under the age of 5.
Vietnamese Disability Age Under 5
It is essential to understand that the correlation between the percentage of Vietnamese and percentage of population with a disability under the age of 5 does not imply a direct cause-and-effect relationship. It remains uncertain whether the presence of Vietnamese influences an upward or downward trend in the level of percentage of population with a disability under the age of 5 within an area, or if Vietnamese simply ended up residing in those areas with higher or lower levels of percentage of population with a disability under the age of 5 due to other factors.

Demographics Similar to Vietnamese by Disability Age Under 5

In terms of disability age under 5, the demographic groups most similar to Vietnamese are Immigrants from St. Vincent and the Grenadines (0.79%, a difference of 3.2%), Immigrants from Uzbekistan (0.85%, a difference of 4.6%), Immigrants from Bangladesh (0.85%, a difference of 5.0%), Ute (0.86%, a difference of 6.0%), and Immigrants from Armenia (0.76%, a difference of 7.4%).
DemographicsRating | RankDisability Age Under 5
Immigrants from Armenia
100.0
/100
|
#1
Exceptional
0.76%
Immigrants from St. Vincent and the Grenadines
100.0
/100
|
#2
Exceptional
0.79%
Vietnamese
100.0
/100
|
#3
Exceptional
0.81%
Immigrants from Uzbekistan
100.0
/100
|
#4
Exceptional
0.85%
Immigrants from Bangladesh
100.0
/100
|
#5
Exceptional
0.85%
Ute
100.0
/100
|
#6
Exceptional
0.86%
Immigrants from Afghanistan
100.0
/100
|
#7
Exceptional
0.91%
Immigrants from Yemen
100.0
/100
|
#8
Exceptional
0.91%
Immigrants from Fiji
100.0
/100
|
#9
Exceptional
0.92%
Marshallese
100.0
/100
|
#10
Exceptional
0.94%
Afghans
100.0
/100
|
#11
Exceptional
0.94%
Immigrants from Grenada
100.0
/100
|
#12
Exceptional
0.94%
Soviet Union
100.0
/100
|
#13
Exceptional
0.95%
Yuman
100.0
/100
|
#14
Exceptional
0.95%
Immigrants from Hong Kong
100.0
/100
|
#15
Exceptional
0.95%

Vietnamese Disability Age Under 5 Correlation Summary

MeasurementVietnamese DataDisability Age Under 5 Data
Minimum0.037%0.070%
Maximum21.0%2.0%
Range21.0%2.0%
Mean3.3%1.0%
Median1.8%0.93%
Interquartile 25% (IQ1)0.88%0.79%
Interquartile 75% (IQ3)4.0%1.3%
Interquartile Range (IQR)3.2%0.50%
Standard Deviation (Sample)4.4%0.47%
Standard Deviation (Population)4.3%0.46%

Correlation Details

Vietnamese PercentileSample SizeDisability Age Under 5
[
0.0%
-
0.5%
]
0.037%
69,956,5920.89%
[
0.0%
-
0.5%
]
0.12%
17,236,0390.94%
[
0.0%
-
0.5%
]
0.21%
8,191,2611.0%
[
0.0%
-
0.5%
]
0.30%
3,231,7441.3%
[
0.0%
-
0.5%
]
0.39%
1,941,9231.1%
[
0.0%
-
0.5%
]
0.47%
2,314,5690.97%
[
0.5%
-
1.0%
]
0.57%
681,3840.85%
[
0.5%
-
1.0%
]
0.64%
690,7211.3%
[
0.5%
-
1.0%
]
0.72%
213,6910.82%
[
0.5%
-
1.0%
]
0.84%
302,7761.3%
[
0.5%
-
1.0%
]
0.92%
178,8930.92%
[
1.0%
-
1.5%
]
1.04%
8,965,4540.51%
[
1.0%
-
1.5%
]
1.08%
64,5410.74%
[
1.0%
-
1.5%
]
1.16%
102,3791.9%
[
1.0%
-
1.5%
]
1.24%
88,1551.3%
[
1.0%
-
1.5%
]
1.33%
448,3121.2%
[
1.0%
-
1.5%
]
1.42%
91,0920.61%
[
1.5%
-
2.0%
]
1.62%
96,3540.84%
[
1.5%
-
2.0%
]
1.69%
138,3900.84%
[
1.5%
-
2.0%
]
1.82%
42,1400.46%
[
1.5%
-
2.0%
]
1.87%
80,3512.0%
[
2.0%
-
2.5%
]
2.00%
24,4410.44%
[
2.0%
-
2.5%
]
2.09%
42,8470.89%
[
2.0%
-
2.5%
]
2.29%
195,4331.5%
[
2.0%
-
2.5%
]
2.50%
9,9601.3%
[
2.5%
-
3.0%
]
2.64%
138,5880.78%
[
3.0%
-
3.5%
]
3.13%
34,2790.90%
[
3.0%
-
3.5%
]
3.17%
19,9231.7%
[
3.0%
-
3.5%
]
3.43%
108,1801.2%
[
3.5%
-
4.0%
]
3.84%
40,1980.92%
[
4.0%
-
4.5%
]
4.26%
31,2000.79%
[
4.0%
-
4.5%
]
4.34%
67,0012.0%
[
4.5%
-
5.0%
]
4.75%
27,8480.070%
[
5.0%
-
5.5%
]
5.01%
46,5201.2%
[
5.0%
-
5.5%
]
5.10%
77,2301.8%
[
6.0%
-
6.5%
]
6.34%
102,6180.33%
[
6.5%
-
7.0%
]
6.64%
27,7941.6%
[
10.0%
-
10.5%
]
10.27%
38,8650.95%
[
18.0%
-
18.5%
]
18.18%
43,2130.20%
[
21.0%
-
21.5%
]
21.03%
64,2680.48%