Samoan Disability Age Under 5

COMPARE

Samoan
Race
Ancestry
AfghanAfricanAlaska NativeAlaskan AthabascanAlbanianAleutAlsatianAmericanApacheArabArapahoArgentineanArmenianAssyrian/Chaldean/SyriacAustralianAustrianBahamianBangladeshiBarbadianBasqueBelgianBelizeanBermudanBhutaneseBlackfeetBolivianBrazilianBritishBritish West IndianBulgarianBurmeseCajunCambodianCanadianCape VerdeanCarpatho RusynCelticCentral AmericanCentral American IndianCherokeeCheyenneChickasawChileanChineseChippewaChoctawColombianColvilleComancheCosta RicanCreeCreekCroatianCrowCubanCypriotCzechCzechoslovakianDanishDelawareDominicanDutchDutch West IndianEastern EuropeanEcuadorianEgyptianEnglishEstonianEthiopianEuropeanFijianFilipinoFinnishFrenchFrench American IndianFrench CanadianGermanGerman RussianGhanaianGreekGuamanian/ChamorroGuatemalanGuyaneseHaitianHmongHonduranHopiHoumaHungarianIcelanderIndian (Asian)IndonesianInupiatIranianIraqiIrishIroquoisIsraeliItalianJamaicanJapaneseJordanianKenyanKiowaKoreanLaotianLatvianLebaneseLiberianLithuanianLumbeeLuxembourgerMacedonianMalaysianMalteseMarshalleseMenomineeMexicanMexican American IndianMongolianMoroccanNative HawaiianNavajoNepaleseNew ZealanderNicaraguanNigerianNorthern EuropeanNorwegianOkinawanOsageOttawaPaiutePakistaniPalestinianPanamanianParaguayanPennsylvania GermanPeruvianPimaPolishPortuguesePotawatomiPuebloPuerto RicanPuget Sound SalishRomanianRussianSalvadoranSamoanScandinavianScotch-IrishScottishSeminoleSenegaleseSerbianShoshoneSierra LeoneanSiouxSlavicSlovakSloveneSomaliSouth AfricanSouth AmericanSouth American IndianSoviet UnionSpaniardSpanishSpanish AmericanSpanish American IndianSri LankanSubsaharan AfricanSudaneseSwedishSwissSyrianTaiwaneseThaiTlingit-HaidaTohono O'OdhamTonganTrinidadian and TobagonianTsimshianTurkishU.S. Virgin IslanderUgandanUkrainianUruguayanUteVenezuelanVietnameseWelshWest IndianYakamaYaquiYugoslavianYumanYup'ikZimbabwean
Immigration
NonimmigrantsImmigrantsAfghanistanAfricaAlbaniaArgentinaArmeniaAsiaAustraliaAustriaBahamasBangladeshBarbadosBelarusBelgiumBelizeBoliviaBosnia and HerzegovinaBrazilBulgariaBurma/MyanmarCabo VerdeCambodiaCameroonCanadaCaribbeanCentral AmericaChileChinaColombiaCongoCosta RicaCroatiaCubaCzechoslovakiaDenmarkDominicaDominican RepublicEastern AfricaEastern AsiaEastern EuropeEcuadorEgyptEl SalvadorEnglandEritreaEthiopiaEuropeFijiFranceGermanyGhanaGreeceGrenadaGuatemalaGuyanaHaitiHondurasHong KongHungaryIndiaIndonesiaIranIraqIrelandIsraelItalyJamaicaJapanJordanKazakhstanKenyaKoreaKuwaitLaosLatin AmericaLatviaLebanonLiberiaLithuaniaMalaysiaMexicoMicronesiaMiddle AfricaMoldovaMoroccoNepalNetherlandsNicaraguaNigeriaNorth AmericaNorth MacedoniaNorthern AfricaNorthern EuropeNorwayOceaniaPakistanPanamaPeruPhilippinesPolandPortugalRomaniaRussiaSaudi ArabiaScotlandSenegalSerbiaSierra LeoneSingaporeSomaliaSouth AfricaSouth AmericaSouth Central AsiaSouth Eastern AsiaSouthern EuropeSpainSri LankaSt. Vincent and the GrenadinesSudanSwedenSwitzerlandSyriaTaiwanThailandTrinidad and TobagoTurkeyUgandaUkraineUruguayUzbekistanVenezuelaVietnamWest IndiesWestern AfricaWestern AsiaWestern EuropeYemenZaireZimbabweAzores
Select to Compare
Race
Ancestry
AfghanAfricanAlaska NativeAlaskan AthabascanAlbanianAleutAlsatianAmericanApacheArabArapahoArgentineanArmenianAssyrian/Chaldean/SyriacAustralianAustrianBahamianBangladeshiBarbadianBasqueBelgianBelizeanBermudanBhutaneseBlackfeetBolivianBrazilianBritishBritish West IndianBulgarianBurmeseCajunCambodianCanadianCape VerdeanCarpatho RusynCelticCentral AmericanCentral American IndianCherokeeCheyenneChickasawChileanChineseChippewaChoctawColombianColvilleComancheCosta RicanCreeCreekCroatianCrowCubanCypriotCzechCzechoslovakianDanishDelawareDominicanDutchDutch West IndianEastern EuropeanEcuadorianEgyptianEnglishEstonianEthiopianEuropeanFijianFilipinoFinnishFrenchFrench American IndianFrench CanadianGermanGerman RussianGhanaianGreekGuamanian/ChamorroGuatemalanGuyaneseHaitianHmongHonduranHopiHoumaHungarianIcelanderIndian (Asian)IndonesianInupiatIranianIraqiIrishIroquoisIsraeliItalianJamaicanJapaneseJordanianKenyanKiowaKoreanLaotianLatvianLebaneseLiberianLithuanianLumbeeLuxembourgerMacedonianMalaysianMalteseMarshalleseMenomineeMexicanMexican American IndianMongolianMoroccanNative HawaiianNavajoNepaleseNew ZealanderNicaraguanNigerianNorthern EuropeanNorwegianOkinawanOsageOttawaPaiutePakistaniPalestinianPanamanianParaguayanPennsylvania GermanPeruvianPimaPolishPortuguesePotawatomiPuebloPuerto RicanPuget Sound SalishRomanianRussianSalvadoranScandinavianScotch-IrishScottishSeminoleSenegaleseSerbianShoshoneSierra LeoneanSiouxSlavicSlovakSloveneSomaliSouth AfricanSouth AmericanSouth American IndianSoviet UnionSpaniardSpanishSpanish AmericanSpanish American IndianSri LankanSubsaharan AfricanSudaneseSwedishSwissSyrianTaiwaneseThaiTlingit-HaidaTohono O'OdhamTonganTrinidadian and TobagonianTsimshianTurkishU.S. Virgin IslanderUgandanUkrainianUruguayanUteVenezuelanVietnameseWelshWest IndianYakamaYaquiYugoslavianYumanYup'ikZimbabwean
Immigration
NonimmigrantsImmigrantsAfghanistanAfricaAlbaniaArgentinaArmeniaAsiaAustraliaAustriaBahamasBangladeshBarbadosBelarusBelgiumBelizeBoliviaBosnia and HerzegovinaBrazilBulgariaBurma/MyanmarCabo VerdeCambodiaCameroonCanadaCaribbeanCentral AmericaChileChinaColombiaCongoCosta RicaCroatiaCubaCzechoslovakiaDenmarkDominicaDominican RepublicEastern AfricaEastern AsiaEastern EuropeEcuadorEgyptEl SalvadorEnglandEritreaEthiopiaEuropeFijiFranceGermanyGhanaGreeceGrenadaGuatemalaGuyanaHaitiHondurasHong KongHungaryIndiaIndonesiaIranIraqIrelandIsraelItalyJamaicaJapanJordanKazakhstanKenyaKoreaKuwaitLaosLatin AmericaLatviaLebanonLiberiaLithuaniaMalaysiaMexicoMicronesiaMiddle AfricaMoldovaMoroccoNepalNetherlandsNicaraguaNigeriaNorth AmericaNorth MacedoniaNorthern AfricaNorthern EuropeNorwayOceaniaPakistanPanamaPeruPhilippinesPolandPortugalRomaniaRussiaSaudi ArabiaScotlandSenegalSerbiaSierra LeoneSingaporeSomaliaSouth AfricaSouth AmericaSouth Central AsiaSouth Eastern AsiaSouthern EuropeSpainSri LankaSt. Vincent and the GrenadinesSudanSwedenSwitzerlandSyriaTaiwanThailandTrinidad and TobagoTurkeyUgandaUkraineUruguayUzbekistanVenezuelaVietnamWest IndiesWestern AfricaWestern AsiaWestern EuropeYemenZaireZimbabweAzores
Disability Age Under 5
Income
Poverty
Unemployment
Labor Participation
Family Structure
Vehicle Availability
Education Level
Disability

Samoan Disability Age Under 5
Good

1.2%
DISABILITY | AGE UNDER 5
77.7/ 100
METRIC RATING
146th/ 347
METRIC RANK

Samoan Disability Age Under 5 Correlation Chart

The statistical analysis conducted on geographies consisting of 152,568,773 people shows a weak positive correlation between the proportion of Samoans and percentage of population with a disability under the age of 5 in the United States with a correlation coefficient (R) of 0.234 and weighted average of 1.2%. On average, for every 1% (one percent) increase in Samoans within a typical geography, there is an increase of 0.21% in percentage of population with a disability under the age of 5.
Samoan Disability Age Under 5
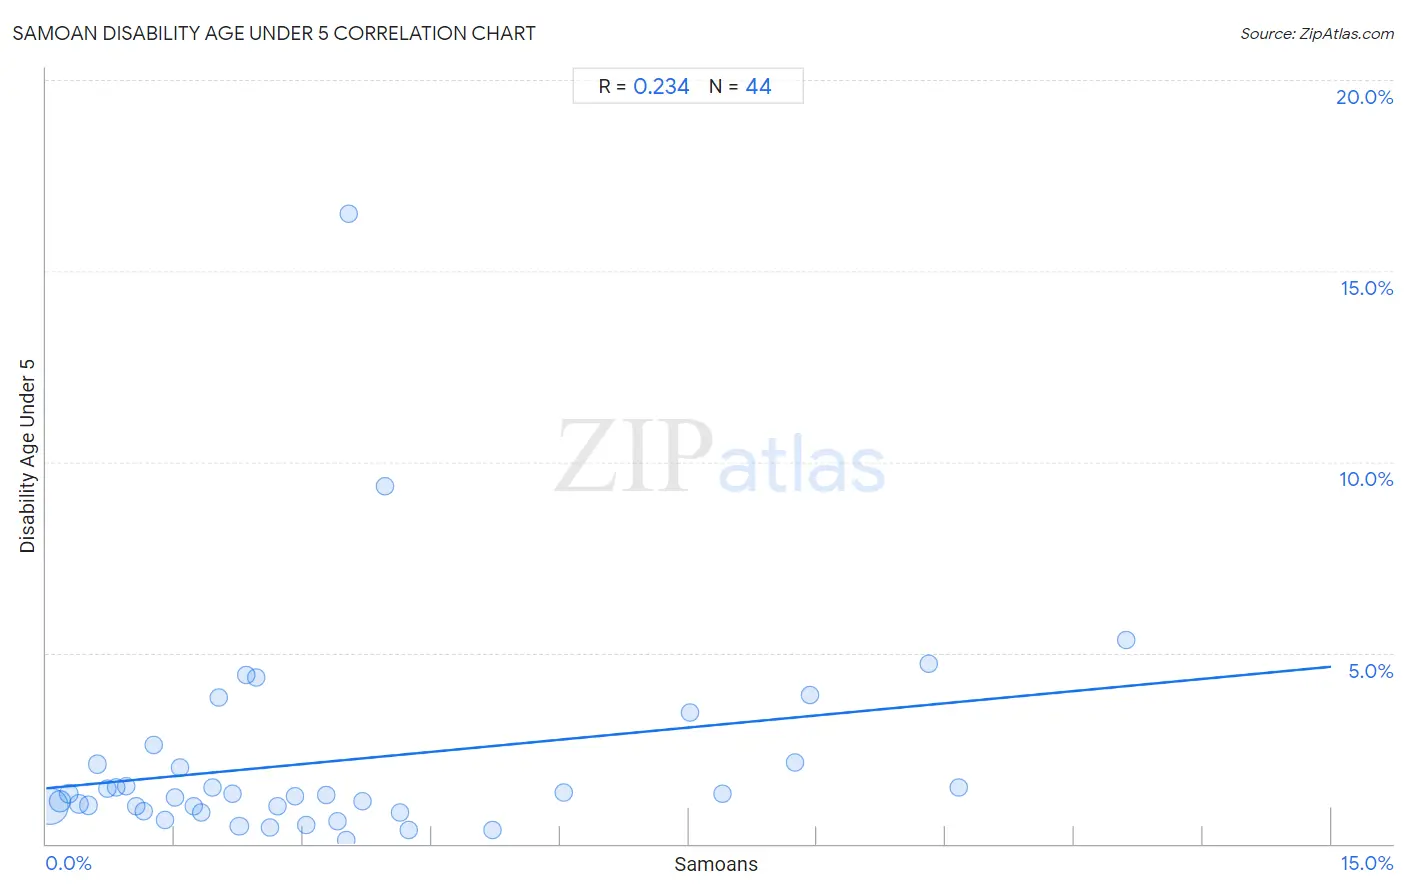
It is essential to understand that the correlation between the percentage of Samoans and percentage of population with a disability under the age of 5 does not imply a direct cause-and-effect relationship. It remains uncertain whether the presence of Samoans influences an upward or downward trend in the level of percentage of population with a disability under the age of 5 within an area, or if Samoans simply ended up residing in those areas with higher or lower levels of percentage of population with a disability under the age of 5 due to other factors.

Demographics Similar to Samoans by Disability Age Under 5

In terms of disability age under 5, the demographic groups most similar to Samoans are Immigrants from Zimbabwe (1.2%, a difference of 0.040%), Icelander (1.2%, a difference of 0.18%), Ghanaian (1.2%, a difference of 0.19%), Alsatian (1.2%, a difference of 0.22%), and Immigrants from Middle Africa (1.2%, a difference of 0.22%).
DemographicsRating | RankDisability Age Under 5
New Zealanders
81.4
/100
|
#139
Excellent
1.2%
Somalis
80.8
/100
|
#140
Excellent
1.2%
Immigrants from Honduras
80.4
/100
|
#141
Excellent
1.2%
Immigrants from Colombia
79.3
/100
|
#142
Good
1.2%
Alsatians
79.3
/100
|
#143
Good
1.2%
Immigrants from Middle Africa
79.3
/100
|
#144
Good
1.2%
Immigrants from Zimbabwe
77.9
/100
|
#145
Good
1.2%
Samoans
77.7
/100
|
#146
Good
1.2%
Icelanders
76.3
/100
|
#147
Good
1.2%
Ghanaians
76.3
/100
|
#148
Good
1.2%
Kenyans
75.9
/100
|
#149
Good
1.2%
South Americans
75.6
/100
|
#150
Good
1.2%
Yaqui
74.8
/100
|
#151
Good
1.2%
Hondurans
72.5
/100
|
#152
Good
1.2%
Immigrants from Thailand
69.4
/100
|
#153
Good
1.2%

Samoan Disability Age Under 5 Correlation Summary

MeasurementSamoan DataDisability Age Under 5 Data
Minimum0.038%0.11%
Maximum12.6%16.5%
Range12.6%16.4%
Mean3.4%2.2%
Median2.4%1.3%
Interquartile 25% (IQ1)1.2%0.91%
Interquartile 75% (IQ3)4.0%2.1%
Interquartile Range (IQR)2.8%1.2%
Standard Deviation (Sample)3.1%2.8%
Standard Deviation (Population)3.1%2.8%

Correlation Details

Samoan PercentileSample SizeDisability Age Under 5
[
0.0%
-
0.5%
]
0.038%
106,391,5230.97%
[
0.0%
-
0.5%
]
0.16%
21,369,4041.1%
[
0.0%
-
0.5%
]
0.26%
7,266,5581.3%
[
0.0%
-
0.5%
]
0.38%
5,212,9851.0%
[
0.0%
-
0.5%
]
0.50%
3,517,7821.0%
[
0.5%
-
1.0%
]
0.60%
1,740,7482.1%
[
0.5%
-
1.0%
]
0.71%
1,015,2691.5%
[
0.5%
-
1.0%
]
0.81%
1,242,9371.5%
[
0.5%
-
1.0%
]
0.93%
781,3451.5%
[
1.0%
-
1.5%
]
1.05%
471,5140.99%
[
1.0%
-
1.5%
]
1.14%
524,7010.84%
[
1.0%
-
1.5%
]
1.26%
405,2592.6%
[
1.0%
-
1.5%
]
1.39%
375,1570.63%
[
1.0%
-
1.5%
]
1.50%
116,4751.2%
[
1.5%
-
2.0%
]
1.57%
84,3212.0%
[
1.5%
-
2.0%
]
1.72%
183,8900.98%
[
1.5%
-
2.0%
]
1.81%
218,8290.82%
[
1.5%
-
2.0%
]
1.93%
57,9381.5%
[
2.0%
-
2.5%
]
2.02%
95,0423.8%
[
2.0%
-
2.5%
]
2.17%
38,2991.3%
[
2.0%
-
2.5%
]
2.25%
357,7090.47%
[
2.0%
-
2.5%
]
2.33%
13,9194.4%
[
2.0%
-
2.5%
]
2.46%
31,9734.3%
[
2.5%
-
3.0%
]
2.61%
324,6890.42%
[
2.5%
-
3.0%
]
2.69%
88,0920.97%
[
2.5%
-
3.0%
]
2.91%
42,7781.3%
[
3.0%
-
3.5%
]
3.04%
46,8120.49%
[
3.0%
-
3.5%
]
3.26%
103,7841.3%
[
3.0%
-
3.5%
]
3.41%
38,6740.60%
[
3.5%
-
4.0%
]
3.51%
40,9380.11%
[
3.5%
-
4.0%
]
3.53%
9,75516.5%
[
3.5%
-
4.0%
]
3.69%
29,2701.1%
[
3.5%
-
4.0%
]
3.96%
8599.4%
[
4.0%
-
4.5%
]
4.13%
72,6050.83%
[
4.0%
-
4.5%
]
4.23%
39,8730.35%
[
5.0%
-
5.5%
]
5.20%
52,3280.37%
[
6.0%
-
6.5%
]
6.04%
72,3241.4%
[
7.5%
-
8.0%
]
7.51%
13,7493.4%
[
7.5%
-
8.0%
]
7.90%
51,3671.3%
[
8.5%
-
9.0%
]
8.74%
10,0422.1%
[
8.5%
-
9.0%
]
8.91%
3,1883.9%
[
10.0%
-
10.5%
]
10.30%
4,5554.7%
[
10.5%
-
11.0%
]
10.66%
5,9211.5%
[
12.5%
-
13.0%
]
12.61%
3,5935.3%