Pakistani Disability Age Under 5

COMPARE

Pakistani
Race
Ancestry
AfghanAfricanAlaska NativeAlaskan AthabascanAlbanianAleutAlsatianAmericanApacheArabArapahoArgentineanArmenianAssyrian/Chaldean/SyriacAustralianAustrianBahamianBangladeshiBarbadianBasqueBelgianBelizeanBermudanBhutaneseBlackfeetBolivianBrazilianBritishBritish West IndianBulgarianBurmeseCajunCambodianCanadianCape VerdeanCarpatho RusynCelticCentral AmericanCentral American IndianCherokeeCheyenneChickasawChileanChineseChippewaChoctawColombianColvilleComancheCosta RicanCreeCreekCroatianCrowCubanCypriotCzechCzechoslovakianDanishDelawareDominicanDutchDutch West IndianEastern EuropeanEcuadorianEgyptianEnglishEstonianEthiopianEuropeanFijianFilipinoFinnishFrenchFrench American IndianFrench CanadianGermanGerman RussianGhanaianGreekGuamanian/ChamorroGuatemalanGuyaneseHaitianHmongHonduranHopiHoumaHungarianIcelanderIndian (Asian)IndonesianInupiatIranianIraqiIrishIroquoisIsraeliItalianJamaicanJapaneseJordanianKenyanKiowaKoreanLaotianLatvianLebaneseLiberianLithuanianLumbeeLuxembourgerMacedonianMalaysianMalteseMarshalleseMenomineeMexicanMexican American IndianMongolianMoroccanNative HawaiianNavajoNepaleseNew ZealanderNicaraguanNigerianNorthern EuropeanNorwegianOkinawanOsageOttawaPaiutePakistaniPalestinianPanamanianParaguayanPennsylvania GermanPeruvianPimaPolishPortuguesePotawatomiPuebloPuerto RicanPuget Sound SalishRomanianRussianSalvadoranSamoanScandinavianScotch-IrishScottishSeminoleSenegaleseSerbianShoshoneSierra LeoneanSiouxSlavicSlovakSloveneSomaliSouth AfricanSouth AmericanSouth American IndianSoviet UnionSpaniardSpanishSpanish AmericanSpanish American IndianSri LankanSubsaharan AfricanSudaneseSwedishSwissSyrianTaiwaneseThaiTlingit-HaidaTohono O'OdhamTonganTrinidadian and TobagonianTsimshianTurkishU.S. Virgin IslanderUgandanUkrainianUruguayanUteVenezuelanVietnameseWelshWest IndianYakamaYaquiYugoslavianYumanYup'ikZimbabwean
Immigration
NonimmigrantsImmigrantsAfghanistanAfricaAlbaniaArgentinaArmeniaAsiaAustraliaAustriaBahamasBangladeshBarbadosBelarusBelgiumBelizeBoliviaBosnia and HerzegovinaBrazilBulgariaBurma/MyanmarCabo VerdeCambodiaCameroonCanadaCaribbeanCentral AmericaChileChinaColombiaCongoCosta RicaCroatiaCubaCzechoslovakiaDenmarkDominicaDominican RepublicEastern AfricaEastern AsiaEastern EuropeEcuadorEgyptEl SalvadorEnglandEritreaEthiopiaEuropeFijiFranceGermanyGhanaGreeceGrenadaGuatemalaGuyanaHaitiHondurasHong KongHungaryIndiaIndonesiaIranIraqIrelandIsraelItalyJamaicaJapanJordanKazakhstanKenyaKoreaKuwaitLaosLatin AmericaLatviaLebanonLiberiaLithuaniaMalaysiaMexicoMicronesiaMiddle AfricaMoldovaMoroccoNepalNetherlandsNicaraguaNigeriaNorth AmericaNorth MacedoniaNorthern AfricaNorthern EuropeNorwayOceaniaPakistanPanamaPeruPhilippinesPolandPortugalRomaniaRussiaSaudi ArabiaScotlandSenegalSerbiaSierra LeoneSingaporeSomaliaSouth AfricaSouth AmericaSouth Central AsiaSouth Eastern AsiaSouthern EuropeSpainSri LankaSt. Vincent and the GrenadinesSudanSwedenSwitzerlandSyriaTaiwanThailandTrinidad and TobagoTurkeyUgandaUkraineUruguayUzbekistanVenezuelaVietnamWest IndiesWestern AfricaWestern AsiaWestern EuropeYemenZaireZimbabweAzores
Select to Compare
Race
Ancestry
AfghanAfricanAlaska NativeAlaskan AthabascanAlbanianAleutAlsatianAmericanApacheArabArapahoArgentineanArmenianAssyrian/Chaldean/SyriacAustralianAustrianBahamianBangladeshiBarbadianBasqueBelgianBelizeanBermudanBhutaneseBlackfeetBolivianBrazilianBritishBritish West IndianBulgarianBurmeseCajunCambodianCanadianCape VerdeanCarpatho RusynCelticCentral AmericanCentral American IndianCherokeeCheyenneChickasawChileanChineseChippewaChoctawColombianColvilleComancheCosta RicanCreeCreekCroatianCrowCubanCypriotCzechCzechoslovakianDanishDelawareDominicanDutchDutch West IndianEastern EuropeanEcuadorianEgyptianEnglishEstonianEthiopianEuropeanFijianFilipinoFinnishFrenchFrench American IndianFrench CanadianGermanGerman RussianGhanaianGreekGuamanian/ChamorroGuatemalanGuyaneseHaitianHmongHonduranHopiHoumaHungarianIcelanderIndian (Asian)IndonesianInupiatIranianIraqiIrishIroquoisIsraeliItalianJamaicanJapaneseJordanianKenyanKiowaKoreanLaotianLatvianLebaneseLiberianLithuanianLumbeeLuxembourgerMacedonianMalaysianMalteseMarshalleseMenomineeMexicanMexican American IndianMongolianMoroccanNative HawaiianNavajoNepaleseNew ZealanderNicaraguanNigerianNorthern EuropeanNorwegianOkinawanOsageOttawaPaiutePalestinianPanamanianParaguayanPennsylvania GermanPeruvianPimaPolishPortuguesePotawatomiPuebloPuerto RicanPuget Sound SalishRomanianRussianSalvadoranSamoanScandinavianScotch-IrishScottishSeminoleSenegaleseSerbianShoshoneSierra LeoneanSiouxSlavicSlovakSloveneSomaliSouth AfricanSouth AmericanSouth American IndianSoviet UnionSpaniardSpanishSpanish AmericanSpanish American IndianSri LankanSubsaharan AfricanSudaneseSwedishSwissSyrianTaiwaneseThaiTlingit-HaidaTohono O'OdhamTonganTrinidadian and TobagonianTsimshianTurkishU.S. Virgin IslanderUgandanUkrainianUruguayanUteVenezuelanVietnameseWelshWest IndianYakamaYaquiYugoslavianYumanYup'ikZimbabwean
Immigration
NonimmigrantsImmigrantsAfghanistanAfricaAlbaniaArgentinaArmeniaAsiaAustraliaAustriaBahamasBangladeshBarbadosBelarusBelgiumBelizeBoliviaBosnia and HerzegovinaBrazilBulgariaBurma/MyanmarCabo VerdeCambodiaCameroonCanadaCaribbeanCentral AmericaChileChinaColombiaCongoCosta RicaCroatiaCubaCzechoslovakiaDenmarkDominicaDominican RepublicEastern AfricaEastern AsiaEastern EuropeEcuadorEgyptEl SalvadorEnglandEritreaEthiopiaEuropeFijiFranceGermanyGhanaGreeceGrenadaGuatemalaGuyanaHaitiHondurasHong KongHungaryIndiaIndonesiaIranIraqIrelandIsraelItalyJamaicaJapanJordanKazakhstanKenyaKoreaKuwaitLaosLatin AmericaLatviaLebanonLiberiaLithuaniaMalaysiaMexicoMicronesiaMiddle AfricaMoldovaMoroccoNepalNetherlandsNicaraguaNigeriaNorth AmericaNorth MacedoniaNorthern AfricaNorthern EuropeNorwayOceaniaPakistanPanamaPeruPhilippinesPolandPortugalRomaniaRussiaSaudi ArabiaScotlandSenegalSerbiaSierra LeoneSingaporeSomaliaSouth AfricaSouth AmericaSouth Central AsiaSouth Eastern AsiaSouthern EuropeSpainSri LankaSt. Vincent and the GrenadinesSudanSwedenSwitzerlandSyriaTaiwanThailandTrinidad and TobagoTurkeyUgandaUkraineUruguayUzbekistanVenezuelaVietnamWest IndiesWestern AfricaWestern AsiaWestern EuropeYemenZaireZimbabweAzores
Disability Age Under 5
Income
Poverty
Unemployment
Labor Participation
Family Structure
Vehicle Availability
Education Level
Disability

Pakistani Disability Age Under 5
Poor

1.3%
DISABILITY | AGE UNDER 5
19.4/ 100
METRIC RATING
210th/ 347
METRIC RANK

Pakistani Disability Age Under 5 Correlation Chart

The statistical analysis conducted on geographies consisting of 195,172,066 people shows a significant positive correlation between the proportion of Pakistanis and percentage of population with a disability under the age of 5 in the United States with a correlation coefficient (R) of 0.674 and weighted average of 1.3%. On average, for every 1% (one percent) increase in Pakistanis within a typical geography, there is an increase of 8.1% in percentage of population with a disability under the age of 5.
Pakistani Disability Age Under 5
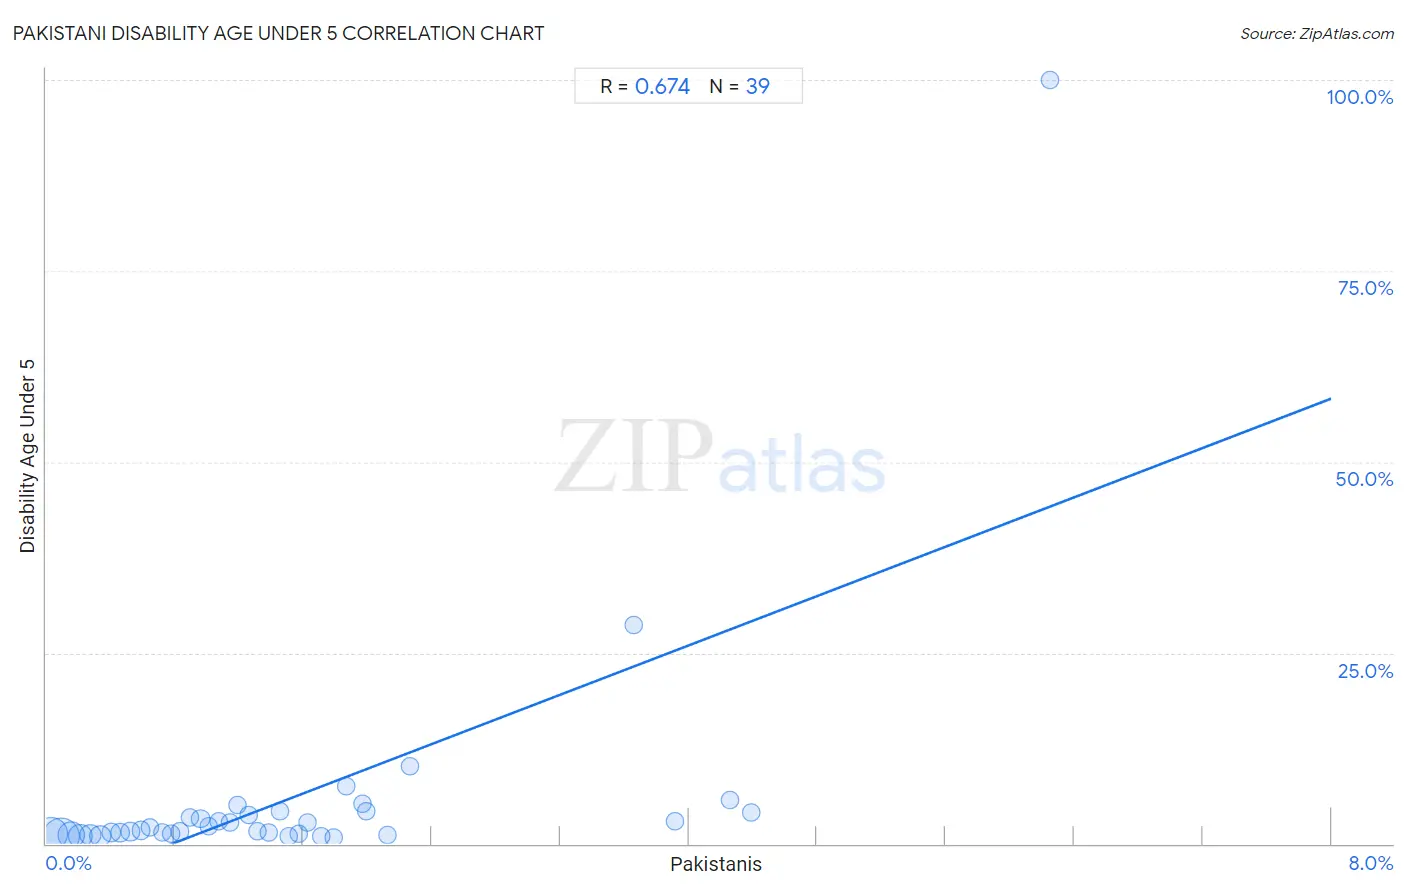
It is essential to understand that the correlation between the percentage of Pakistanis and percentage of population with a disability under the age of 5 does not imply a direct cause-and-effect relationship. It remains uncertain whether the presence of Pakistanis influences an upward or downward trend in the level of percentage of population with a disability under the age of 5 within an area, or if Pakistanis simply ended up residing in those areas with higher or lower levels of percentage of population with a disability under the age of 5 due to other factors.

Demographics Similar to Pakistanis by Disability Age Under 5

In terms of disability age under 5, the demographic groups most similar to Pakistanis are Bulgarian (1.3%, a difference of 0.010%), Immigrants from Greece (1.3%, a difference of 0.040%), Chilean (1.3%, a difference of 0.090%), Immigrants from Sudan (1.3%, a difference of 0.10%), and Mexican (1.3%, a difference of 0.19%).
DemographicsRating | RankDisability Age Under 5
Liberians
24.0
/100
|
#203
Fair
1.3%
Immigrants from Europe
23.6
/100
|
#204
Fair
1.3%
Romanians
22.5
/100
|
#205
Fair
1.3%
Immigrants from Poland
22.4
/100
|
#206
Fair
1.3%
Nigerians
21.2
/100
|
#207
Fair
1.3%
Mexicans
20.8
/100
|
#208
Fair
1.3%
Bulgarians
19.5
/100
|
#209
Poor
1.3%
Pakistanis
19.4
/100
|
#210
Poor
1.3%
Immigrants from Greece
19.1
/100
|
#211
Poor
1.3%
Chileans
18.8
/100
|
#212
Poor
1.3%
Immigrants from Sudan
18.7
/100
|
#213
Poor
1.3%
Immigrants from Chile
17.2
/100
|
#214
Poor
1.3%
Syrians
16.1
/100
|
#215
Poor
1.3%
Bangladeshis
15.5
/100
|
#216
Poor
1.3%
Cypriots
14.9
/100
|
#217
Poor
1.3%

Pakistani Disability Age Under 5 Correlation Summary

MeasurementPakistani DataDisability Age Under 5 Data
Minimum0.035%0.81%
Maximum6.2%100.0%
Range6.2%99.2%
Mean1.5%5.8%
Median1.2%1.8%
Interquartile 25% (IQ1)0.59%1.3%
Interquartile 75% (IQ3)1.9%4.1%
Interquartile Range (IQR)1.3%2.8%
Standard Deviation (Sample)1.3%16.2%
Standard Deviation (Population)1.3%15.9%

Correlation Details

Pakistani PercentileSample SizeDisability Age Under 5
[
0.0%
-
0.5%
]
0.035%
49,654,4771.3%
[
0.0%
-
0.5%
]
0.091%
62,438,3190.96%
[
0.0%
-
0.5%
]
0.15%
29,075,1491.1%
[
0.0%
-
0.5%
]
0.21%
18,969,7671.0%
[
0.0%
-
0.5%
]
0.28%
9,819,2761.1%
[
0.0%
-
0.5%
]
0.34%
10,768,3741.0%
[
0.0%
-
0.5%
]
0.40%
3,941,5091.4%
[
0.0%
-
0.5%
]
0.46%
3,242,2461.5%
[
0.5%
-
1.0%
]
0.52%
1,853,2321.6%
[
0.5%
-
1.0%
]
0.59%
1,394,1801.8%
[
0.5%
-
1.0%
]
0.64%
529,0072.2%
[
0.5%
-
1.0%
]
0.72%
523,5281.4%
[
0.5%
-
1.0%
]
0.77%
654,8021.3%
[
0.5%
-
1.0%
]
0.83%
587,9551.6%
[
0.5%
-
1.0%
]
0.90%
207,9163.4%
[
0.5%
-
1.0%
]
0.96%
292,4603.3%
[
1.0%
-
1.5%
]
1.01%
161,4452.2%
[
1.0%
-
1.5%
]
1.08%
81,7252.9%
[
1.0%
-
1.5%
]
1.14%
121,0572.7%
[
1.0%
-
1.5%
]
1.19%
56,0855.1%
[
1.0%
-
1.5%
]
1.26%
60,2813.7%
[
1.0%
-
1.5%
]
1.31%
164,0631.6%
[
1.0%
-
1.5%
]
1.38%
60,5611.4%
[
1.0%
-
1.5%
]
1.46%
24,5544.3%
[
1.5%
-
2.0%
]
1.51%
124,7401.0%
[
1.5%
-
2.0%
]
1.57%
64,5941.3%
[
1.5%
-
2.0%
]
1.62%
29,3302.7%
[
1.5%
-
2.0%
]
1.71%
20,9191.0%
[
1.5%
-
2.0%
]
1.79%
145,8410.81%
[
1.5%
-
2.0%
]
1.87%
12,6727.5%
[
1.5%
-
2.0%
]
1.97%
28,9935.2%
[
1.5%
-
2.0%
]
1.99%
9,8944.3%
[
2.0%
-
2.5%
]
2.12%
16,1121.2%
[
2.0%
-
2.5%
]
2.27%
12,21110.2%
[
3.5%
-
4.0%
]
3.66%
32828.6%
[
3.5%
-
4.0%
]
3.91%
15,1322.9%
[
4.0%
-
4.5%
]
4.26%
7,5815.7%
[
4.0%
-
4.5%
]
4.39%
1,2074.1%
[
6.0%
-
6.5%
]
6.25%
544100.0%