Immigrants from Uzbekistan Disability Age Under 5

COMPARE

Immigrants from Uzbekistan
Race
Ancestry
AfghanAfricanAlaska NativeAlaskan AthabascanAlbanianAleutAlsatianAmericanApacheArabArapahoArgentineanArmenianAssyrian/Chaldean/SyriacAustralianAustrianBahamianBangladeshiBarbadianBasqueBelgianBelizeanBermudanBhutaneseBlackfeetBolivianBrazilianBritishBritish West IndianBulgarianBurmeseCajunCambodianCanadianCape VerdeanCarpatho RusynCelticCentral AmericanCentral American IndianCherokeeCheyenneChickasawChileanChineseChippewaChoctawColombianColvilleComancheCosta RicanCreeCreekCroatianCrowCubanCypriotCzechCzechoslovakianDanishDelawareDominicanDutchDutch West IndianEastern EuropeanEcuadorianEgyptianEnglishEstonianEthiopianEuropeanFijianFilipinoFinnishFrenchFrench American IndianFrench CanadianGermanGerman RussianGhanaianGreekGuamanian/ChamorroGuatemalanGuyaneseHaitianHmongHonduranHopiHoumaHungarianIcelanderIndian (Asian)IndonesianInupiatIranianIraqiIrishIroquoisIsraeliItalianJamaicanJapaneseJordanianKenyanKiowaKoreanLaotianLatvianLebaneseLiberianLithuanianLumbeeLuxembourgerMacedonianMalaysianMalteseMarshalleseMenomineeMexicanMexican American IndianMongolianMoroccanNative HawaiianNavajoNepaleseNew ZealanderNicaraguanNigerianNorthern EuropeanNorwegianOkinawanOsageOttawaPaiutePakistaniPalestinianPanamanianParaguayanPennsylvania GermanPeruvianPimaPolishPortuguesePotawatomiPuebloPuerto RicanPuget Sound SalishRomanianRussianSalvadoranSamoanScandinavianScotch-IrishScottishSeminoleSenegaleseSerbianShoshoneSierra LeoneanSiouxSlavicSlovakSloveneSomaliSouth AfricanSouth AmericanSouth American IndianSoviet UnionSpaniardSpanishSpanish AmericanSpanish American IndianSri LankanSubsaharan AfricanSudaneseSwedishSwissSyrianTaiwaneseThaiTlingit-HaidaTohono O'OdhamTonganTrinidadian and TobagonianTsimshianTurkishU.S. Virgin IslanderUgandanUkrainianUruguayanUteVenezuelanVietnameseWelshWest IndianYakamaYaquiYugoslavianYumanYup'ikZimbabwean
Immigration
NonimmigrantsImmigrantsAfghanistanAfricaAlbaniaArgentinaArmeniaAsiaAustraliaAustriaBahamasBangladeshBarbadosBelarusBelgiumBelizeBoliviaBosnia and HerzegovinaBrazilBulgariaBurma/MyanmarCabo VerdeCambodiaCameroonCanadaCaribbeanCentral AmericaChileChinaColombiaCongoCosta RicaCroatiaCubaCzechoslovakiaDenmarkDominicaDominican RepublicEastern AfricaEastern AsiaEastern EuropeEcuadorEgyptEl SalvadorEnglandEritreaEthiopiaEuropeFijiFranceGermanyGhanaGreeceGrenadaGuatemalaGuyanaHaitiHondurasHong KongHungaryIndiaIndonesiaIranIraqIrelandIsraelItalyJamaicaJapanJordanKazakhstanKenyaKoreaKuwaitLaosLatin AmericaLatviaLebanonLiberiaLithuaniaMalaysiaMexicoMicronesiaMiddle AfricaMoldovaMoroccoNepalNetherlandsNicaraguaNigeriaNorth AmericaNorth MacedoniaNorthern AfricaNorthern EuropeNorwayOceaniaPakistanPanamaPeruPhilippinesPolandPortugalRomaniaRussiaSaudi ArabiaScotlandSenegalSerbiaSierra LeoneSingaporeSomaliaSouth AfricaSouth AmericaSouth Central AsiaSouth Eastern AsiaSouthern EuropeSpainSri LankaSt. Vincent and the GrenadinesSudanSwedenSwitzerlandSyriaTaiwanThailandTrinidad and TobagoTurkeyUgandaUkraineUruguayUzbekistanVenezuelaVietnamWest IndiesWestern AfricaWestern AsiaWestern EuropeYemenZaireZimbabweAzores
Select to Compare
Race
Ancestry
AfghanAfricanAlaska NativeAlaskan AthabascanAlbanianAleutAlsatianAmericanApacheArabArapahoArgentineanArmenianAssyrian/Chaldean/SyriacAustralianAustrianBahamianBangladeshiBarbadianBasqueBelgianBelizeanBermudanBhutaneseBlackfeetBolivianBrazilianBritishBritish West IndianBulgarianBurmeseCajunCambodianCanadianCape VerdeanCarpatho RusynCelticCentral AmericanCentral American IndianCherokeeCheyenneChickasawChileanChineseChippewaChoctawColombianColvilleComancheCosta RicanCreeCreekCroatianCrowCubanCypriotCzechCzechoslovakianDanishDelawareDominicanDutchDutch West IndianEastern EuropeanEcuadorianEgyptianEnglishEstonianEthiopianEuropeanFijianFilipinoFinnishFrenchFrench American IndianFrench CanadianGermanGerman RussianGhanaianGreekGuamanian/ChamorroGuatemalanGuyaneseHaitianHmongHonduranHopiHoumaHungarianIcelanderIndian (Asian)IndonesianInupiatIranianIraqiIrishIroquoisIsraeliItalianJamaicanJapaneseJordanianKenyanKiowaKoreanLaotianLatvianLebaneseLiberianLithuanianLumbeeLuxembourgerMacedonianMalaysianMalteseMarshalleseMenomineeMexicanMexican American IndianMongolianMoroccanNative HawaiianNavajoNepaleseNew ZealanderNicaraguanNigerianNorthern EuropeanNorwegianOkinawanOsageOttawaPaiutePakistaniPalestinianPanamanianParaguayanPennsylvania GermanPeruvianPimaPolishPortuguesePotawatomiPuebloPuerto RicanPuget Sound SalishRomanianRussianSalvadoranSamoanScandinavianScotch-IrishScottishSeminoleSenegaleseSerbianShoshoneSierra LeoneanSiouxSlavicSlovakSloveneSomaliSouth AfricanSouth AmericanSouth American IndianSoviet UnionSpaniardSpanishSpanish AmericanSpanish American IndianSri LankanSubsaharan AfricanSudaneseSwedishSwissSyrianTaiwaneseThaiTlingit-HaidaTohono O'OdhamTonganTrinidadian and TobagonianTsimshianTurkishU.S. Virgin IslanderUgandanUkrainianUruguayanUteVenezuelanVietnameseWelshWest IndianYakamaYaquiYugoslavianYumanYup'ikZimbabwean
Immigration
NonimmigrantsImmigrantsAfghanistanAfricaAlbaniaArgentinaArmeniaAsiaAustraliaAustriaBahamasBangladeshBarbadosBelarusBelgiumBelizeBoliviaBosnia and HerzegovinaBrazilBulgariaBurma/MyanmarCabo VerdeCambodiaCameroonCanadaCaribbeanCentral AmericaChileChinaColombiaCongoCosta RicaCroatiaCubaCzechoslovakiaDenmarkDominicaDominican RepublicEastern AfricaEastern AsiaEastern EuropeEcuadorEgyptEl SalvadorEnglandEritreaEthiopiaEuropeFijiFranceGermanyGhanaGreeceGrenadaGuatemalaGuyanaHaitiHondurasHong KongHungaryIndiaIndonesiaIranIraqIrelandIsraelItalyJamaicaJapanJordanKazakhstanKenyaKoreaKuwaitLaosLatin AmericaLatviaLebanonLiberiaLithuaniaMalaysiaMexicoMicronesiaMiddle AfricaMoldovaMoroccoNepalNetherlandsNicaraguaNigeriaNorth AmericaNorth MacedoniaNorthern AfricaNorthern EuropeNorwayOceaniaPakistanPanamaPeruPhilippinesPolandPortugalRomaniaRussiaSaudi ArabiaScotlandSenegalSerbiaSierra LeoneSingaporeSomaliaSouth AfricaSouth AmericaSouth Central AsiaSouth Eastern AsiaSouthern EuropeSpainSri LankaSt. Vincent and the GrenadinesSudanSwedenSwitzerlandSyriaTaiwanThailandTrinidad and TobagoTurkeyUgandaUkraineUruguayVenezuelaVietnamWest IndiesWestern AfricaWestern AsiaWestern EuropeYemenZaireZimbabweAzores
Disability Age Under 5
Income
Poverty
Unemployment
Labor Participation
Family Structure
Vehicle Availability
Education Level
Disability

Immigrants from Uzbekistan Disability Age Under 5
Exceptional

0.85%
DISABILITY | AGE UNDER 5
100.0/ 100
METRIC RATING
4th/ 347
METRIC RANK

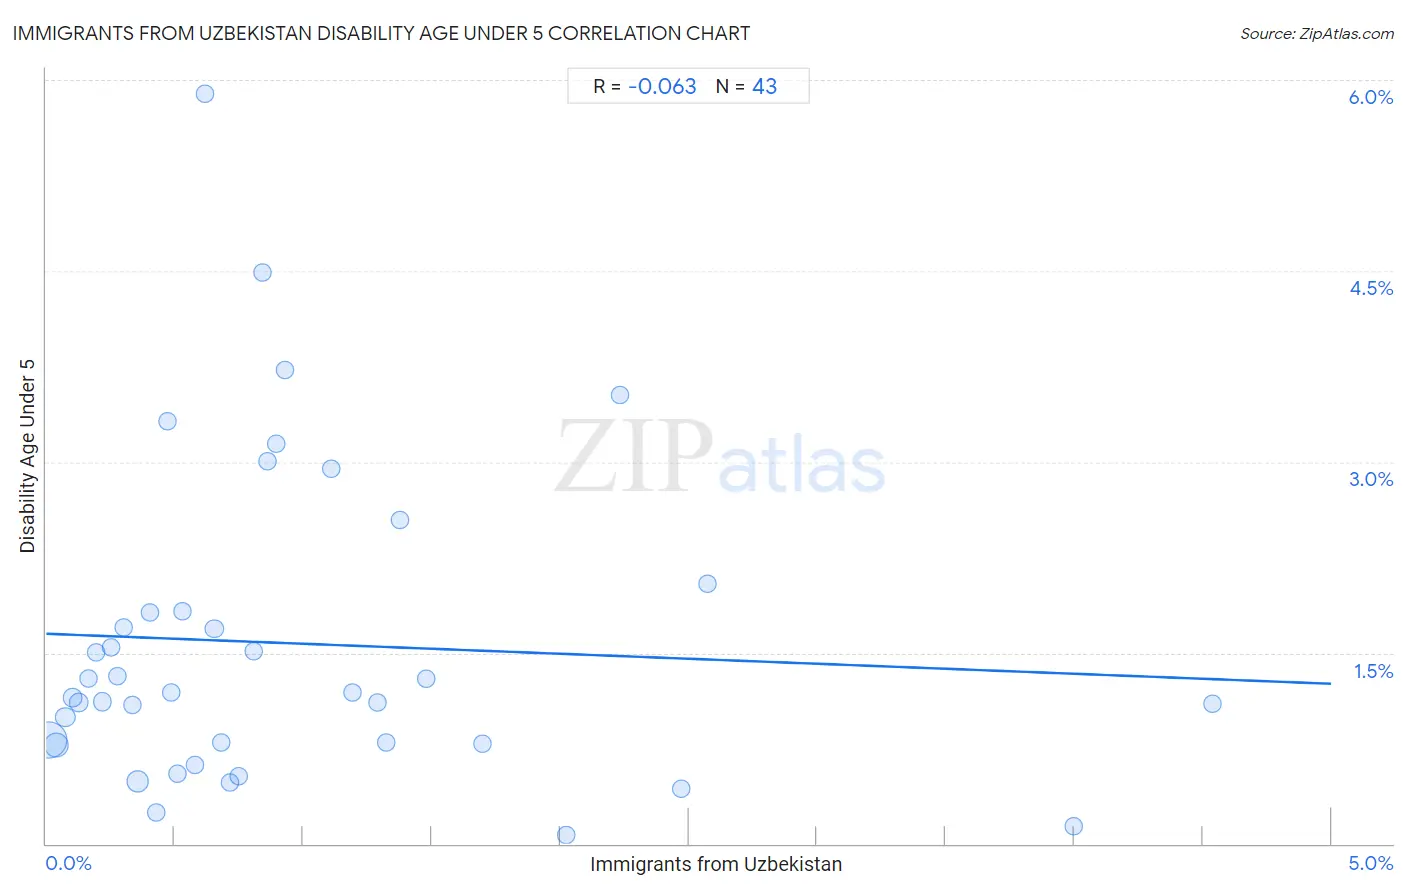
Immigrants from Uzbekistan Disability Age Under 5 Correlation Chart

The statistical analysis conducted on geographies consisting of 86,983,125 people shows a slight negative correlation between the proportion of Immigrants from Uzbekistan and percentage of population with a disability under the age of 5 in the United States with a correlation coefficient (R) of -0.063 and weighted average of 0.85%. On average, for every 1% (one percent) increase in Immigrants from Uzbekistan within a typical geography, there is a decrease of 0.079% in percentage of population with a disability under the age of 5.
Immigrants from Uzbekistan Disability Age Under 5
It is essential to understand that the correlation between the percentage of Immigrants from Uzbekistan and percentage of population with a disability under the age of 5 does not imply a direct cause-and-effect relationship. It remains uncertain whether the presence of Immigrants from Uzbekistan influences an upward or downward trend in the level of percentage of population with a disability under the age of 5 within an area, or if Immigrants from Uzbekistan simply ended up residing in those areas with higher or lower levels of percentage of population with a disability under the age of 5 due to other factors.

Demographics Similar to Immigrants from Uzbekistan by Disability Age Under 5

In terms of disability age under 5, the demographic groups most similar to Immigrants from Uzbekistan are Immigrants from Bangladesh (0.85%, a difference of 0.41%), Ute (0.86%, a difference of 1.3%), Vietnamese (0.81%, a difference of 4.6%), Immigrants from Afghanistan (0.91%, a difference of 6.7%), and Immigrants from Yemen (0.91%, a difference of 6.9%).
DemographicsRating | RankDisability Age Under 5
Immigrants from Armenia
100.0
/100
|
#1
Exceptional
0.76%
Immigrants from St. Vincent and the Grenadines
100.0
/100
|
#2
Exceptional
0.79%
Vietnamese
100.0
/100
|
#3
Exceptional
0.81%
Immigrants from Uzbekistan
100.0
/100
|
#4
Exceptional
0.85%
Immigrants from Bangladesh
100.0
/100
|
#5
Exceptional
0.85%
Ute
100.0
/100
|
#6
Exceptional
0.86%
Immigrants from Afghanistan
100.0
/100
|
#7
Exceptional
0.91%
Immigrants from Yemen
100.0
/100
|
#8
Exceptional
0.91%
Immigrants from Fiji
100.0
/100
|
#9
Exceptional
0.92%
Marshallese
100.0
/100
|
#10
Exceptional
0.94%
Afghans
100.0
/100
|
#11
Exceptional
0.94%
Immigrants from Grenada
100.0
/100
|
#12
Exceptional
0.94%
Soviet Union
100.0
/100
|
#13
Exceptional
0.95%
Yuman
100.0
/100
|
#14
Exceptional
0.95%
Immigrants from Hong Kong
100.0
/100
|
#15
Exceptional
0.95%

Immigrants from Uzbekistan Disability Age Under 5 Correlation Summary

MeasurementImmigrants from Uzbekistan DataDisability Age Under 5 Data
Minimum0.010%0.069%
Maximum4.5%5.9%
Range4.5%5.8%
Mean0.95%1.6%
Median0.65%1.2%
Interquartile 25% (IQ1)0.30%0.79%
Interquartile 75% (IQ3)1.3%1.8%
Interquartile Range (IQR)0.99%1.0%
Standard Deviation (Sample)0.99%1.2%
Standard Deviation (Population)0.98%1.2%

Correlation Details

Immigrants from Uzbekistan PercentileSample SizeDisability Age Under 5
[
0.0%
-
0.5%
]
0.010%
46,772,4430.82%
[
0.0%
-
0.5%
]
0.039%
15,393,1740.78%
[
0.0%
-
0.5%
]
0.075%
4,683,3070.99%
[
0.0%
-
0.5%
]
0.10%
2,411,3031.1%
[
0.0%
-
0.5%
]
0.13%
3,101,1601.1%
[
0.0%
-
0.5%
]
0.16%
1,098,2121.3%
[
0.0%
-
0.5%
]
0.19%
631,2521.5%
[
0.0%
-
0.5%
]
0.22%
725,4431.1%
[
0.0%
-
0.5%
]
0.25%
694,5301.5%
[
0.0%
-
0.5%
]
0.28%
470,7621.3%
[
0.0%
-
0.5%
]
0.30%
206,0101.7%
[
0.0%
-
0.5%
]
0.34%
344,3411.1%
[
0.0%
-
0.5%
]
0.36%
8,716,5460.49%
[
0.0%
-
0.5%
]
0.40%
123,6621.8%
[
0.0%
-
0.5%
]
0.43%
34,8970.25%
[
0.0%
-
0.5%
]
0.47%
8,4683.3%
[
0.0%
-
0.5%
]
0.49%
132,1571.2%
[
0.5%
-
1.0%
]
0.51%
155,1250.55%
[
0.5%
-
1.0%
]
0.53%
18,6051.8%
[
0.5%
-
1.0%
]
0.58%
176,4370.62%
[
0.5%
-
1.0%
]
0.62%
31,4815.9%
[
0.5%
-
1.0%
]
0.65%
74,4491.7%
[
0.5%
-
1.0%
]
0.68%
52,6570.80%
[
0.5%
-
1.0%
]
0.72%
64,2680.48%
[
0.5%
-
1.0%
]
0.75%
104,7520.53%
[
0.5%
-
1.0%
]
0.81%
17,9861.5%
[
0.5%
-
1.0%
]
0.84%
6,5254.5%
[
0.5%
-
1.0%
]
0.86%
14,1603.0%
[
0.5%
-
1.0%
]
0.90%
56,2323.1%
[
0.5%
-
1.0%
]
0.93%
55,8903.7%
[
1.0%
-
1.5%
]
1.11%
24,3102.9%
[
1.0%
-
1.5%
]
1.19%
20,3151.2%
[
1.0%
-
1.5%
]
1.29%
40,2081.1%
[
1.0%
-
1.5%
]
1.32%
47,8930.79%
[
1.0%
-
1.5%
]
1.38%
82,2302.5%
[
1.0%
-
1.5%
]
1.48%
23,2441.3%
[
1.5%
-
2.0%
]
1.70%
43,2860.79%
[
2.0%
-
2.5%
]
2.02%
80,5750.069%
[
2.0%
-
2.5%
]
2.23%
14,2913.5%
[
2.0%
-
2.5%
]
2.47%
80,1130.44%
[
2.5%
-
3.0%
]
2.57%
20,1272.0%
[
4.0%
-
4.5%
]
4.00%
83,0690.14%
[
4.5%
-
5.0%
]
4.54%
47,2301.1%