Slovene Disability Age Under 5
COMPARE
Slovene
Select to Compare
Disability Age Under 5
Slovene Disability Age Under 5
1.4%
DISABILITY | AGE UNDER 5
0.3/ 100
METRIC RATING
257th/ 347
METRIC RANK
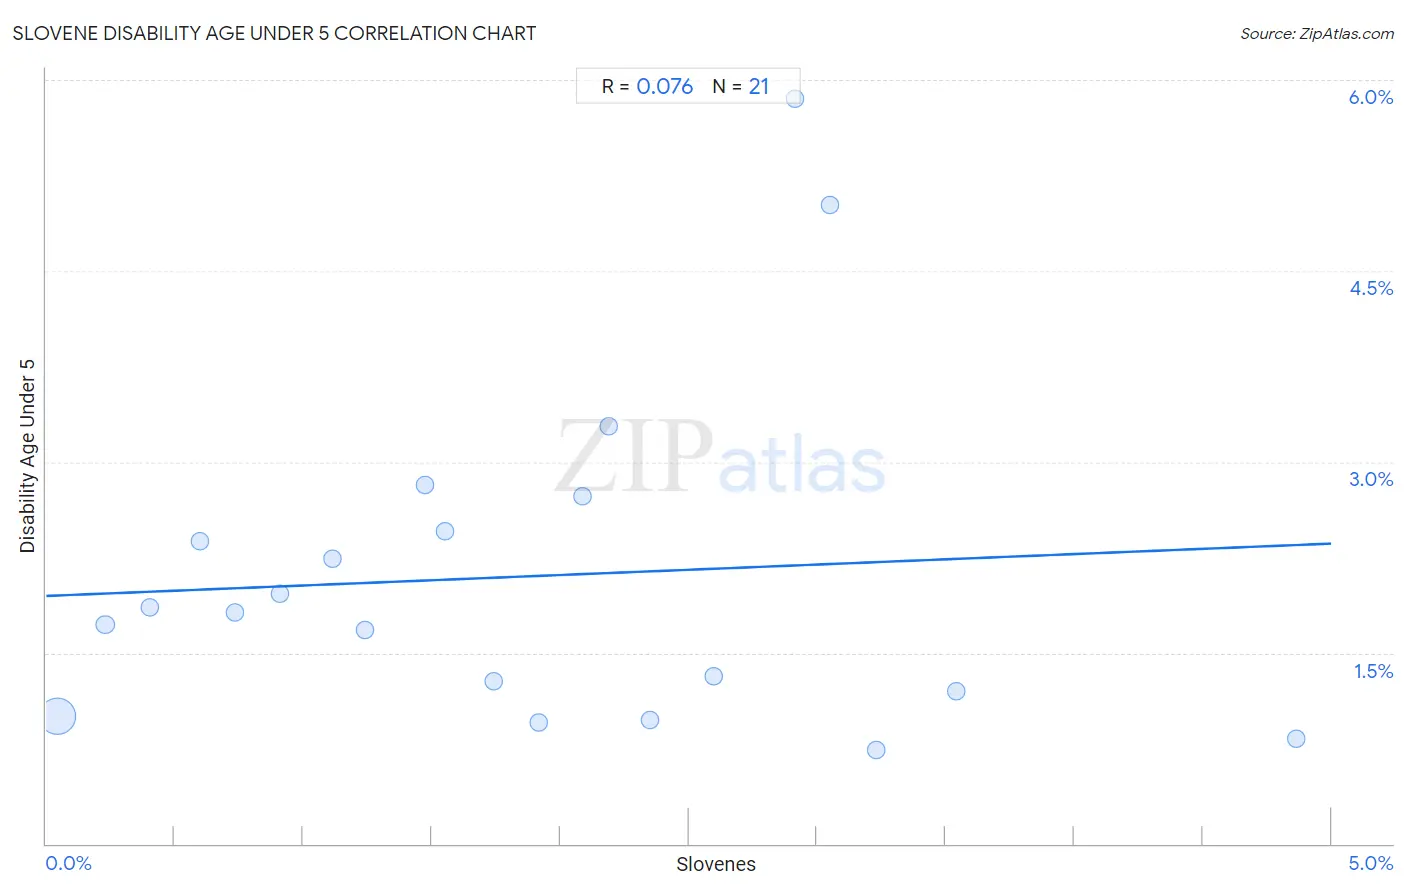
Slovene Disability Age Under 5 Correlation Chart
The statistical analysis conducted on geographies consisting of 155,245,072 people shows a slight positive correlation between the proportion of Slovenes and percentage of population with a disability under the age of 5 in the United States with a correlation coefficient (R) of 0.076 and weighted average of 1.4%. On average, for every 1% (one percent) increase in Slovenes within a typical geography, there is an increase of 0.082% in percentage of population with a disability under the age of 5.
It is essential to understand that the correlation between the percentage of Slovenes and percentage of population with a disability under the age of 5 does not imply a direct cause-and-effect relationship. It remains uncertain whether the presence of Slovenes influences an upward or downward trend in the level of percentage of population with a disability under the age of 5 within an area, or if Slovenes simply ended up residing in those areas with higher or lower levels of percentage of population with a disability under the age of 5 due to other factors.
Demographics Similar to Slovenes by Disability Age Under 5
In terms of disability age under 5, the demographic groups most similar to Slovenes are Costa Rican (1.4%, a difference of 0.19%), Immigrants from Southern Europe (1.4%, a difference of 0.34%), Slavic (1.4%, a difference of 0.55%), Immigrants from Western Europe (1.4%, a difference of 0.89%), and Immigrants from Netherlands (1.4%, a difference of 1.2%).
| Demographics | Rating | Rank | Disability Age Under 5 |
| Africans | 1.0 /100 | #250 | Tragic 1.4% |
| Immigrants from Hungary | 1.0 /100 | #251 | Tragic 1.4% |
| Immigrants from Scotland | 0.9 /100 | #252 | Tragic 1.4% |
| Australians | 0.7 /100 | #253 | Tragic 1.4% |
| Immigrants from Brazil | 0.7 /100 | #254 | Tragic 1.4% |
| Immigrants from Liberia | 0.6 /100 | #255 | Tragic 1.4% |
| Immigrants from Western Europe | 0.5 /100 | #256 | Tragic 1.4% |
| Slovenes | 0.3 /100 | #257 | Tragic 1.4% |
| Costa Ricans | 0.3 /100 | #258 | Tragic 1.4% |
| Immigrants from Southern Europe | 0.3 /100 | #259 | Tragic 1.4% |
| Slavs | 0.3 /100 | #260 | Tragic 1.4% |
| Immigrants from Netherlands | 0.2 /100 | #261 | Tragic 1.4% |
| Immigrants from Dominica | 0.2 /100 | #262 | Tragic 1.4% |
| Spanish | 0.2 /100 | #263 | Tragic 1.4% |
| Yugoslavians | 0.1 /100 | #264 | Tragic 1.4% |
Slovene Disability Age Under 5 Correlation Summary
| Measurement | Slovene Data | Disability Age Under 5 Data |
| Minimum | 0.042% | 0.73% |
| Maximum | 4.9% | 5.9% |
| Range | 4.8% | 5.1% |
| Mean | 1.8% | 2.1% |
| Median | 1.7% | 1.8% |
| Interquartile 25% (IQ1) | 0.82% | 1.1% |
| Interquartile 75% (IQ3) | 2.8% | 2.6% |
| Interquartile Range (IQR) | 1.9% | 1.5% |
| Standard Deviation (Sample) | 1.2% | 1.3% |
| Standard Deviation (Population) | 1.2% | 1.3% |
Correlation Details
| Slovene Percentile | Sample Size | Disability Age Under 5 |
[ 0.0% - 0.5% ] 0.042% | 143,974,692 | 1.00% |
[ 0.0% - 0.5% ] 0.23% | 6,148,436 | 1.7% |
[ 0.0% - 0.5% ] 0.40% | 2,143,846 | 1.9% |
[ 0.5% - 1.0% ] 0.60% | 896,310 | 2.4% |
[ 0.5% - 1.0% ] 0.74% | 568,293 | 1.8% |
[ 0.5% - 1.0% ] 0.91% | 499,558 | 2.0% |
[ 1.0% - 1.5% ] 1.11% | 108,699 | 2.2% |
[ 1.0% - 1.5% ] 1.24% | 363,672 | 1.7% |
[ 1.0% - 1.5% ] 1.47% | 131,005 | 2.8% |
[ 1.5% - 2.0% ] 1.55% | 68,701 | 2.5% |
[ 1.5% - 2.0% ] 1.74% | 107,261 | 1.3% |
[ 1.5% - 2.0% ] 1.91% | 15,408 | 0.95% |
[ 2.0% - 2.5% ] 2.08% | 39,536 | 2.7% |
[ 2.0% - 2.5% ] 2.19% | 1,917 | 3.3% |
[ 2.0% - 2.5% ] 2.35% | 20,387 | 0.97% |
[ 2.5% - 3.0% ] 2.60% | 19,987 | 1.3% |
[ 2.5% - 3.0% ] 2.91% | 11,151 | 5.9% |
[ 3.0% - 3.5% ] 3.05% | 4,424 | 5.0% |
[ 3.0% - 3.5% ] 3.23% | 3,064 | 0.73% |
[ 3.5% - 4.0% ] 3.54% | 58,793 | 1.2% |
[ 4.5% - 5.0% ] 4.86% | 59,932 | 0.82% |