Immigrants from Norway Disability Age Under 5
COMPARE
Immigrants from Norway
Select to Compare
Disability Age Under 5
Immigrants from Norway Disability Age Under 5
1.3%
DISABILITY | AGE UNDER 5
31.1/ 100
METRIC RATING
198th/ 347
METRIC RANK
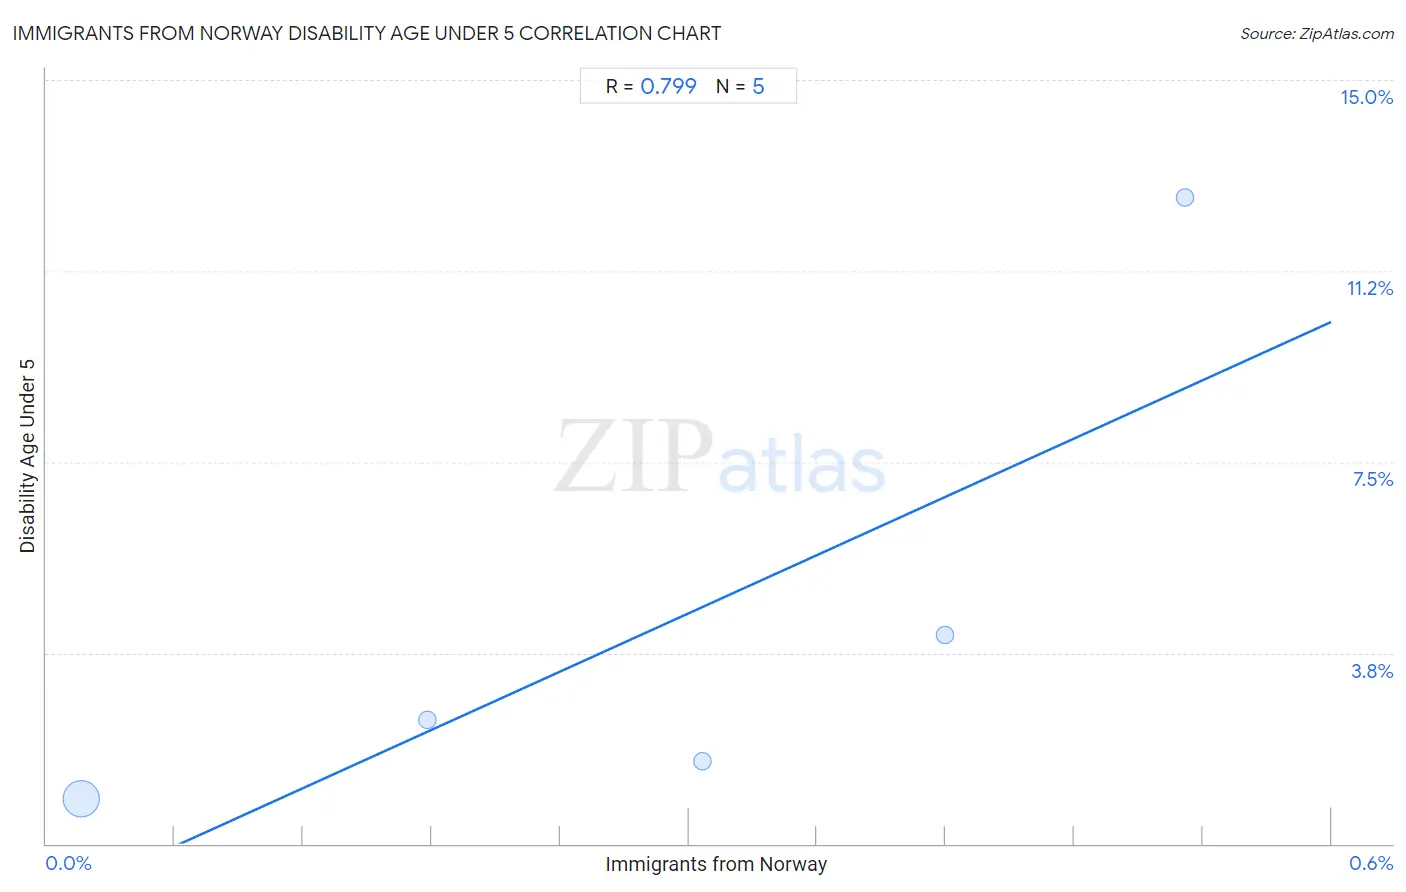
Immigrants from Norway Disability Age Under 5 Correlation Chart
The statistical analysis conducted on geographies consisting of 84,343,493 people shows a strong positive correlation between the proportion of Immigrants from Norway and percentage of population with a disability under the age of 5 in the United States with a correlation coefficient (R) of 0.799 and weighted average of 1.3%. On average, for every 1% (one percent) increase in Immigrants from Norway within a typical geography, there is an increase of 19.1% in percentage of population with a disability under the age of 5.
It is essential to understand that the correlation between the percentage of Immigrants from Norway and percentage of population with a disability under the age of 5 does not imply a direct cause-and-effect relationship. It remains uncertain whether the presence of Immigrants from Norway influences an upward or downward trend in the level of percentage of population with a disability under the age of 5 within an area, or if Immigrants from Norway simply ended up residing in those areas with higher or lower levels of percentage of population with a disability under the age of 5 due to other factors.
Demographics Similar to Immigrants from Norway by Disability Age Under 5
In terms of disability age under 5, the demographic groups most similar to Immigrants from Norway are Immigrants from Somalia (1.3%, a difference of 0.030%), Immigrants from Belgium (1.3%, a difference of 0.040%), Jamaican (1.3%, a difference of 0.040%), U.S. Virgin Islander (1.3%, a difference of 0.34%), and Immigrants from North Macedonia (1.3%, a difference of 0.37%).
| Demographics | Rating | Rank | Disability Age Under 5 |
| Mexican American Indians | 36.6 /100 | #191 | Fair 1.3% |
| Immigrants from Bosnia and Herzegovina | 36.5 /100 | #192 | Fair 1.3% |
| Immigrants from Sierra Leone | 36.5 /100 | #193 | Fair 1.3% |
| Immigrants from North Macedonia | 34.7 /100 | #194 | Fair 1.3% |
| U.S. Virgin Islanders | 34.4 /100 | #195 | Fair 1.3% |
| Immigrants from Belgium | 31.4 /100 | #196 | Fair 1.3% |
| Immigrants from Somalia | 31.3 /100 | #197 | Fair 1.3% |
| Immigrants from Norway | 31.1 /100 | #198 | Fair 1.3% |
| Jamaicans | 30.7 /100 | #199 | Fair 1.3% |
| Immigrants from Lithuania | 27.2 /100 | #200 | Fair 1.3% |
| Immigrants from Italy | 25.4 /100 | #201 | Fair 1.3% |
| Arapaho | 24.1 /100 | #202 | Fair 1.3% |
| Liberians | 24.0 /100 | #203 | Fair 1.3% |
| Immigrants from Europe | 23.6 /100 | #204 | Fair 1.3% |
| Romanians | 22.5 /100 | #205 | Fair 1.3% |
Immigrants from Norway Disability Age Under 5 Correlation Summary
| Measurement | Immigrants from Norway Data | Disability Age Under 5 Data |
| Minimum | 0.016% | 0.87% |
| Maximum | 0.53% | 12.7% |
| Range | 0.52% | 11.8% |
| Mean | 0.29% | 4.3% |
| Median | 0.31% | 2.4% |
| Interquartile 25% (IQ1) | 0.097% | 1.2% |
| Interquartile 75% (IQ3) | 0.48% | 8.4% |
| Interquartile Range (IQR) | 0.38% | 7.2% |
| Standard Deviation (Sample) | 0.20% | 4.8% |
| Standard Deviation (Population) | 0.18% | 4.3% |
Correlation Details
| Immigrants from Norway Percentile | Sample Size | Disability Age Under 5 |
[ 0.0% - 0.5% ] 0.016% | 83,120,945 | 0.87% |
[ 0.0% - 0.5% ] 0.18% | 850,578 | 2.4% |
[ 0.0% - 0.5% ] 0.31% | 231,767 | 1.6% |
[ 0.0% - 0.5% ] 0.42% | 107,300 | 4.1% |
[ 0.5% - 1.0% ] 0.53% | 32,903 | 12.7% |