Irish Disability Age Under 5
COMPARE
Irish
Select to Compare
Disability Age Under 5
Irish Disability Age Under 5
1.7%
DISABILITY | AGE UNDER 5
0.0/ 100
METRIC RATING
318th/ 347
METRIC RANK
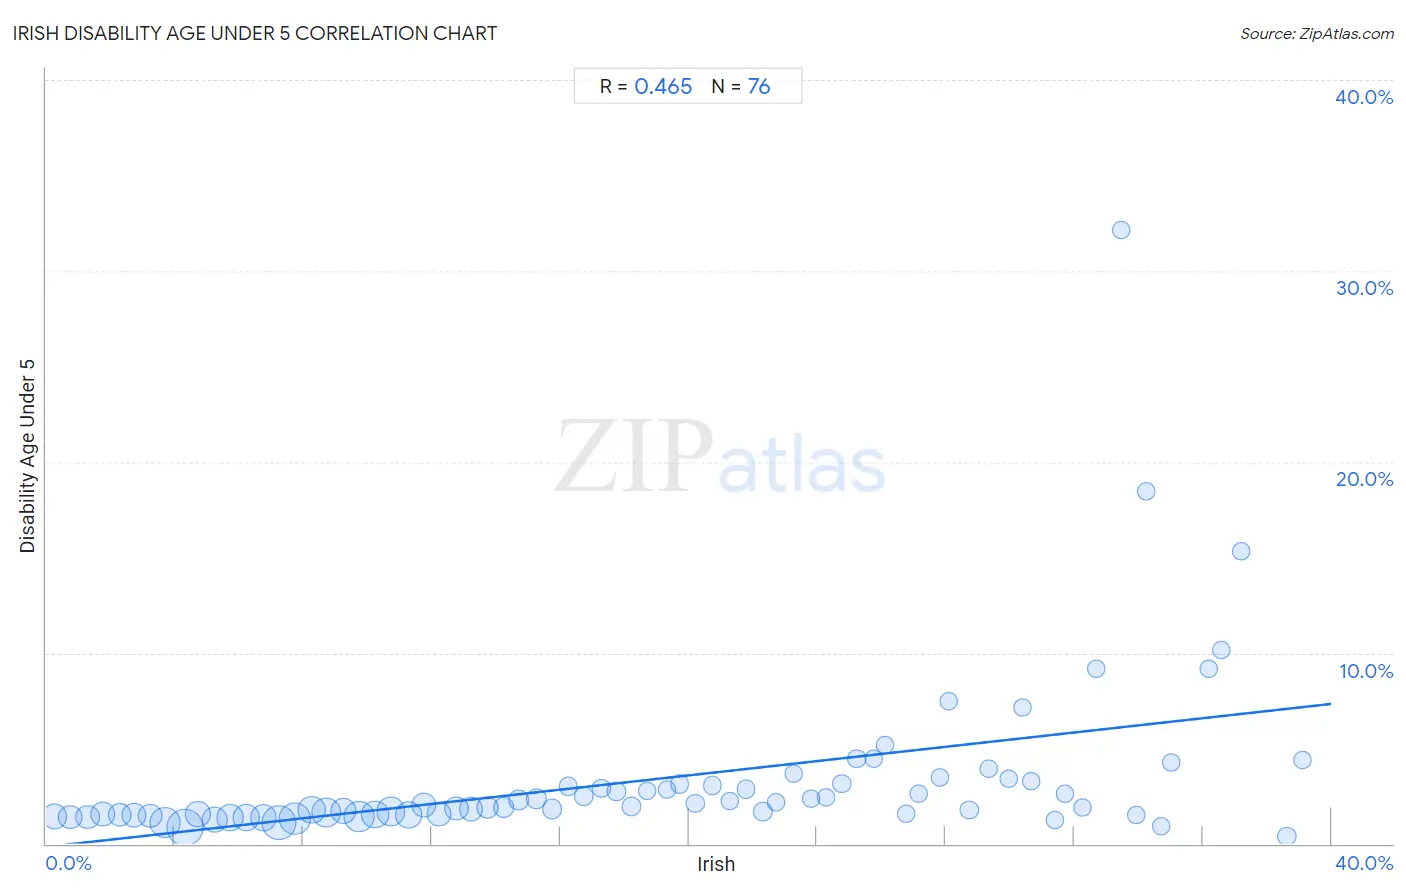
Irish Disability Age Under 5 Correlation Chart
The statistical analysis conducted on geographies consisting of 261,602,984 people shows a moderate positive correlation between the proportion of Irish and percentage of population with a disability under the age of 5 in the United States with a correlation coefficient (R) of 0.465 and weighted average of 1.7%. On average, for every 1% (one percent) increase in Irish within a typical geography, there is an increase of 0.19% in percentage of population with a disability under the age of 5.
It is essential to understand that the correlation between the percentage of Irish and percentage of population with a disability under the age of 5 does not imply a direct cause-and-effect relationship. It remains uncertain whether the presence of Irish influences an upward or downward trend in the level of percentage of population with a disability under the age of 5 within an area, or if Irish simply ended up residing in those areas with higher or lower levels of percentage of population with a disability under the age of 5 due to other factors.
Demographics Similar to Irish by Disability Age Under 5
In terms of disability age under 5, the demographic groups most similar to Irish are French (1.7%, a difference of 0.27%), Slovak (1.7%, a difference of 0.31%), Immigrants from Cabo Verde (1.7%, a difference of 0.69%), Scotch-Irish (1.7%, a difference of 0.84%), and Dutch (1.7%, a difference of 0.88%).
| Demographics | Rating | Rank | Disability Age Under 5 |
| English | 0.0 /100 | #311 | Tragic 1.7% |
| Puerto Ricans | 0.0 /100 | #312 | Tragic 1.7% |
| Celtics | 0.0 /100 | #313 | Tragic 1.7% |
| Norwegians | 0.0 /100 | #314 | Tragic 1.7% |
| Dutch | 0.0 /100 | #315 | Tragic 1.7% |
| Immigrants from Cabo Verde | 0.0 /100 | #316 | Tragic 1.7% |
| French | 0.0 /100 | #317 | Tragic 1.7% |
| Irish | 0.0 /100 | #318 | Tragic 1.7% |
| Slovaks | 0.0 /100 | #319 | Tragic 1.7% |
| Scotch-Irish | 0.0 /100 | #320 | Tragic 1.7% |
| Ottawa | 0.0 /100 | #321 | Tragic 1.7% |
| Germans | 0.0 /100 | #322 | Tragic 1.7% |
| Chickasaw | 0.0 /100 | #323 | Tragic 1.7% |
| Cherokee | 0.0 /100 | #324 | Tragic 1.8% |
| Immigrants from Portugal | 0.0 /100 | #325 | Tragic 1.8% |
Irish Disability Age Under 5 Correlation Summary
| Measurement | Irish Data | Disability Age Under 5 Data |
| Minimum | 0.26% | 0.37% |
| Maximum | 39.1% | 32.1% |
| Range | 38.9% | 31.8% |
| Mean | 19.1% | 3.4% |
| Median | 19.0% | 2.0% |
| Interquartile 25% (IQ1) | 9.5% | 1.5% |
| Interquartile 75% (IQ3) | 28.4% | 3.2% |
| Interquartile Range (IQR) | 18.9% | 1.6% |
| Standard Deviation (Sample) | 11.1% | 4.5% |
| Standard Deviation (Population) | 11.1% | 4.4% |
Correlation Details
| Irish Percentile | Sample Size | Disability Age Under 5 |
[ 0.0% - 0.5% ] 0.26% | 7,204,715 | 1.4% |
[ 0.5% - 1.0% ] 0.74% | 5,802,718 | 1.4% |
[ 1.0% - 1.5% ] 1.28% | 5,999,387 | 1.4% |
[ 1.5% - 2.0% ] 1.76% | 5,682,006 | 1.6% |
[ 2.0% - 2.5% ] 2.28% | 5,429,625 | 1.5% |
[ 2.5% - 3.0% ] 2.74% | 5,968,411 | 1.5% |
[ 3.0% - 3.5% ] 3.24% | 5,854,595 | 1.5% |
[ 3.5% - 4.0% ] 3.69% | 12,410,931 | 1.1% |
[ 4.0% - 4.5% ] 4.32% | 18,728,619 | 0.88% |
[ 4.5% - 5.0% ] 4.72% | 6,764,033 | 1.5% |
[ 5.0% - 5.5% ] 5.24% | 8,117,052 | 1.3% |
[ 5.5% - 6.0% ] 5.72% | 8,483,332 | 1.3% |
[ 6.0% - 6.5% ] 6.23% | 8,705,371 | 1.4% |
[ 6.5% - 7.0% ] 6.76% | 8,208,869 | 1.4% |
[ 7.0% - 7.5% ] 7.26% | 15,906,469 | 1.1% |
[ 7.5% - 8.0% ] 7.75% | 14,069,969 | 1.3% |
[ 8.0% - 8.5% ] 8.26% | 9,093,865 | 1.8% |
[ 8.5% - 9.0% ] 8.71% | 11,288,319 | 1.6% |
[ 9.0% - 9.5% ] 9.25% | 8,177,445 | 1.7% |
[ 9.5% - 10.0% ] 9.75% | 11,887,621 | 1.4% |
[ 10.0% - 10.5% ] 10.24% | 9,839,257 | 1.5% |
[ 10.5% - 11.0% ] 10.73% | 10,862,990 | 1.7% |
[ 11.0% - 11.5% ] 11.29% | 8,895,799 | 1.5% |
[ 11.5% - 12.0% ] 11.76% | 6,141,919 | 2.1% |
[ 12.0% - 12.5% ] 12.22% | 5,841,608 | 1.6% |
[ 12.5% - 13.0% ] 12.77% | 5,607,203 | 1.8% |
[ 13.0% - 13.5% ] 13.22% | 5,475,772 | 1.8% |
[ 13.5% - 14.0% ] 13.73% | 3,671,762 | 1.9% |
[ 14.0% - 14.5% ] 14.24% | 2,612,184 | 1.9% |
[ 14.5% - 15.0% ] 14.70% | 2,458,561 | 2.3% |
[ 15.0% - 15.5% ] 15.24% | 2,297,213 | 2.4% |
[ 15.5% - 16.0% ] 15.75% | 2,063,339 | 1.8% |
[ 16.0% - 16.5% ] 16.25% | 1,074,670 | 3.0% |
[ 16.5% - 17.0% ] 16.74% | 1,156,148 | 2.5% |
[ 17.0% - 17.5% ] 17.29% | 938,530 | 2.9% |
[ 17.5% - 18.0% ] 17.75% | 902,714 | 2.8% |
[ 18.0% - 18.5% ] 18.21% | 878,151 | 2.0% |
[ 18.5% - 19.0% ] 18.71% | 741,688 | 2.8% |
[ 19.0% - 19.5% ] 19.33% | 873,861 | 2.8% |
[ 19.5% - 20.0% ] 19.71% | 719,541 | 3.1% |
[ 20.0% - 20.5% ] 20.20% | 717,948 | 2.1% |
[ 20.5% - 21.0% ] 20.73% | 327,447 | 3.1% |
[ 21.0% - 21.5% ] 21.28% | 378,901 | 2.2% |
[ 21.5% - 22.0% ] 21.77% | 388,118 | 2.9% |
[ 22.0% - 22.5% ] 22.30% | 535,950 | 1.7% |
[ 22.5% - 23.0% ] 22.73% | 359,818 | 2.1% |
[ 23.0% - 23.5% ] 23.25% | 109,448 | 3.6% |
[ 23.5% - 24.0% ] 23.81% | 263,467 | 2.4% |
[ 24.0% - 24.5% ] 24.28% | 243,532 | 2.4% |
[ 24.5% - 25.0% ] 24.76% | 136,121 | 3.2% |
[ 25.0% - 25.5% ] 25.23% | 174,566 | 4.5% |
[ 25.5% - 26.0% ] 25.75% | 124,796 | 4.4% |
[ 26.0% - 26.5% ] 26.10% | 54,281 | 5.2% |
[ 26.5% - 27.0% ] 26.77% | 105,009 | 1.6% |
[ 27.0% - 27.5% ] 27.16% | 105,926 | 2.6% |
[ 27.5% - 28.0% ] 27.80% | 92,264 | 3.5% |
[ 28.0% - 28.5% ] 28.10% | 73,472 | 7.5% |
[ 28.5% - 29.0% ] 28.74% | 95,503 | 1.8% |
[ 29.0% - 29.5% ] 29.32% | 60,253 | 3.9% |
[ 29.5% - 30.0% ] 29.95% | 44,931 | 3.4% |
[ 30.0% - 30.5% ] 30.39% | 2,218 | 7.1% |
[ 30.5% - 31.0% ] 30.66% | 77,694 | 3.3% |
[ 31.0% - 31.5% ] 31.41% | 64,415 | 1.3% |
[ 31.5% - 32.0% ] 31.70% | 62,509 | 2.6% |
[ 32.0% - 32.5% ] 32.26% | 29,119 | 1.9% |
[ 32.5% - 33.0% ] 32.67% | 7,362 | 9.2% |
[ 33.0% - 33.5% ] 33.46% | 526 | 32.1% |
[ 33.5% - 34.0% ] 33.94% | 24,143 | 1.5% |
[ 34.0% - 34.5% ] 34.26% | 3,567 | 18.5% |
[ 34.5% - 35.0% ] 34.69% | 46,863 | 0.91% |
[ 35.0% - 35.5% ] 35.01% | 5,815 | 4.2% |
[ 36.0% - 36.5% ] 36.19% | 2,545 | 9.1% |
[ 36.5% - 37.0% ] 36.59% | 1,976 | 10.2% |
[ 37.0% - 37.5% ] 37.22% | 7,123 | 15.4% |
[ 38.5% - 39.0% ] 38.62% | 25,915 | 0.37% |
[ 39.0% - 39.5% ] 39.12% | 13,181 | 4.4% |